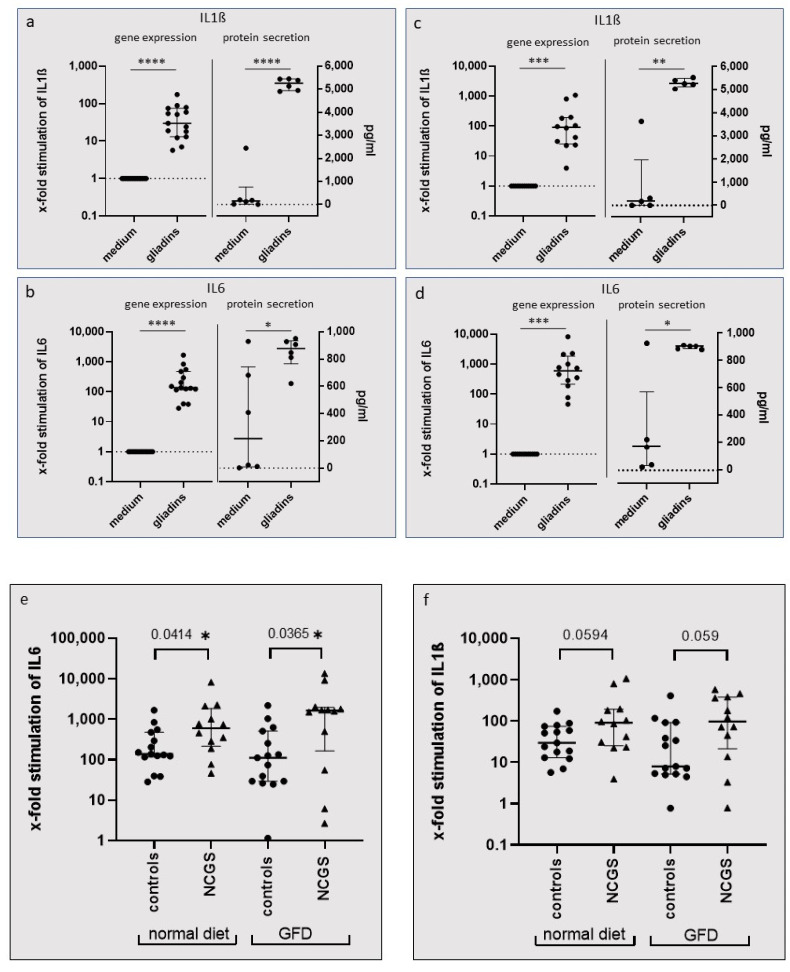
Figure 1.
Gene and protein expression of PBMCs after incubation with tryptic-digested gliadins. All results are shown as median with interquartile range. (a,b) IL1ß and IL6 expression of PBMCs from healthy controls (n = 15) and (c,d) from patients with NCGS (n = 12). The Wilcoxon signed rank test revealed significant upregulation of gene expression of PBMCs after stimulation with gliadins. The paired t-test revealed significant differences in gliadin-induced protein secretion of PBMCs in healthy controls (n = 6) and patients with NCGS (n = 5). (e,f) Gene expression of gliadin stimulated PBMCs under a normal diet and after a 6-week GFD. The Mann–Whitney test was used to detect significant differences in gene expression between NCGS and controls. (e) The gliadin-induced expression of IL6 mRNA was significantly higher in the PBMCs of patients with NCGS compared to controls before (with a normal diet) and also after a 6-week GFD. (f) Stimulation by gliadins caused a distinct upregulation of IL1ß mRNA in the PBMCs of patients with NCGS compared to controls, although not significantly so. Fold-change gene analysis was carried out with the 2ΔΔCt method, using GAPDH as a housekeeping gene, and was related to values for the culture medium without cereal stimulants as control. * p < 0.05; ** p < 0.01, *** p < 0.005, **** p < 0.0001.

