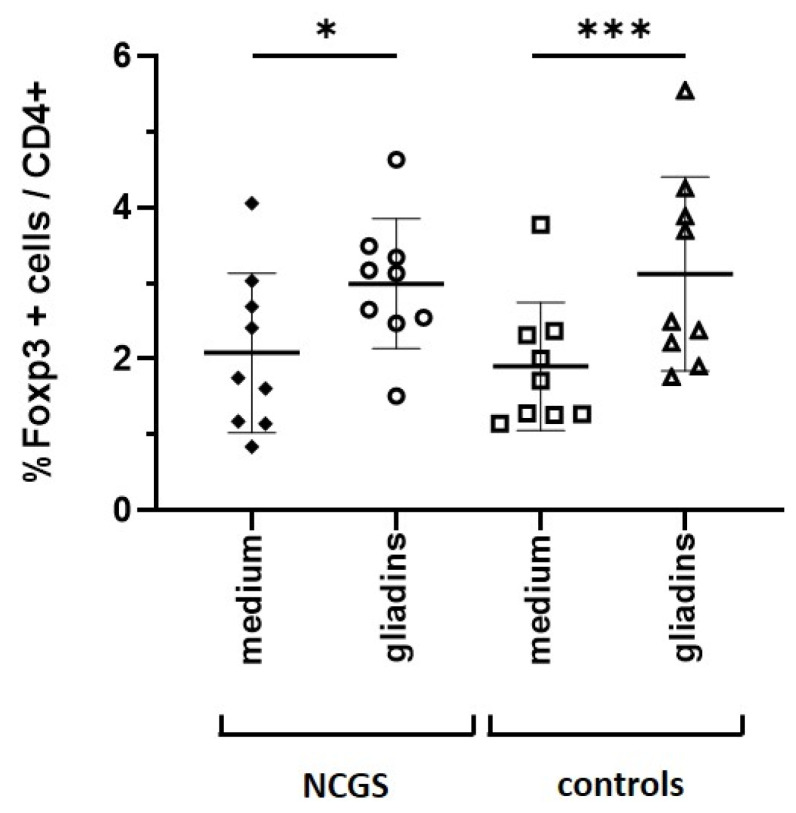
Figure 4.
Percentage of FoxP3+ cells in total CD4+ cells. The paired t-test revealed significant differences in gliadin-induced increase in FoxP3+ regulatory T cells in patients with NCGS (n = 9) and healthy controls (n = 9) compared to medium control. * p < 0.05, *** p < 0.001. Exemplary Fluorescence-activated cell sorting (FACS) panels are shown in Supplementary Figure S2.

