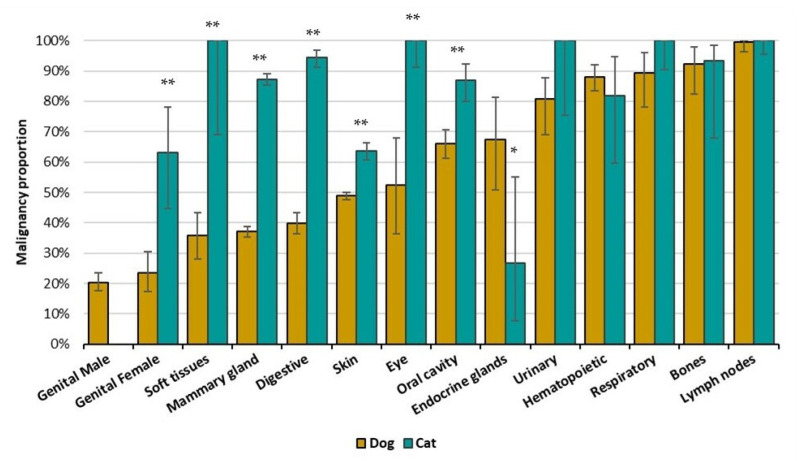
Figure 2.
Malignancy Proportion (MP) per topography groups by species: dogs (yellow) and cats (blue). Bars indicate MP with 95%CI. Dashed line represents the 50% of malignant tumors. Differences of proportions were calculated for the species within each topography, * p < 0.05, ** p < 0.001, Z-test for proportions.

