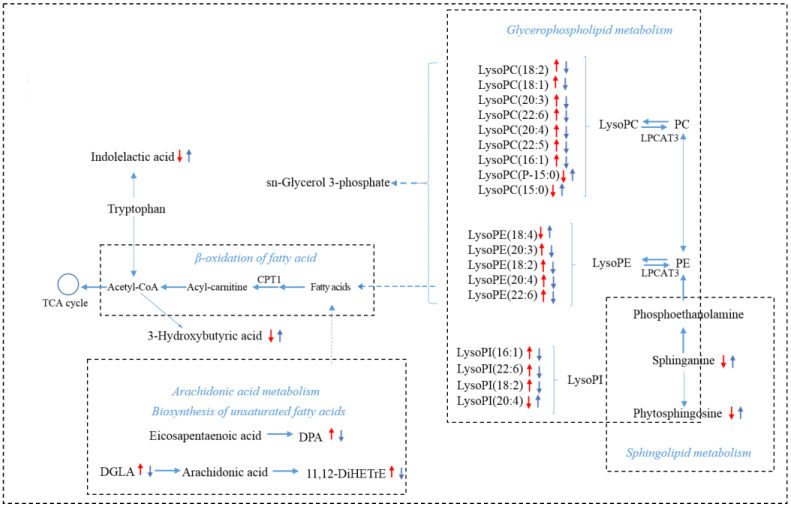
Figure 8.
The regulation of sinomenine on lipid metabolism disorders caused by CAC. The alterations in metabolites in the AOM/DSS group compared with the WT group were labeled with a red arrow, and the changes in the AOM/DSS + SIN group compared with the AOM/DSS group were labeled with blue. The upward arrow indicates a significant increase (p < 0.05), and the downward arrow indicates a significant decrease (p < 0.05).

