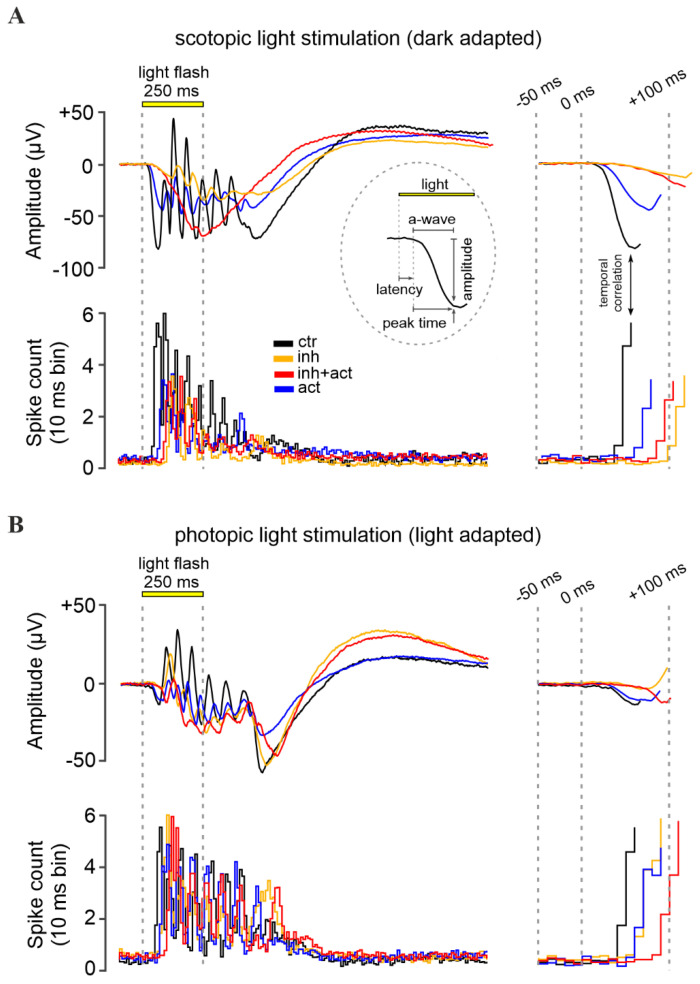
Figure 5.
Effects of cGMP analogues on retinal function. Representative light-evoked dark-adapted scotopic (rod) (A) and light-adapted photopic (cone) (B) micro-electroretinogram (µERG) of the mouse retina. Control recording (black) was compared to retina treated with the CNG-channel inhibitor Rp-8-Br-PET-cGMPS (50 µM, orange), the CNG-channel activator 8-pCPT-cGMP (0.1 µM, blue), or both compounds in combination (red). Displayed below the µERG traces is the correlated retinal ganglion cell spiking activity recorded by multi-electrode arrays (MEA). Data shown at maximum scotopic and photopic light intensity, respectively (see Figures S3 and S4 for µERG recordings at all light intensities). The left panel illustrates the recorded signals, while the right panel highlights the initial light-response features, magnified in time. The initial negative deflection of the µERG, the a-wave, represents the hyperpolarizing photoreceptor response. Subsequent oscillations reflect responses of inner retinal cells. The inset in (A) displays the a-wave evaluation parameters: latency, peak-time, and amplitude.

