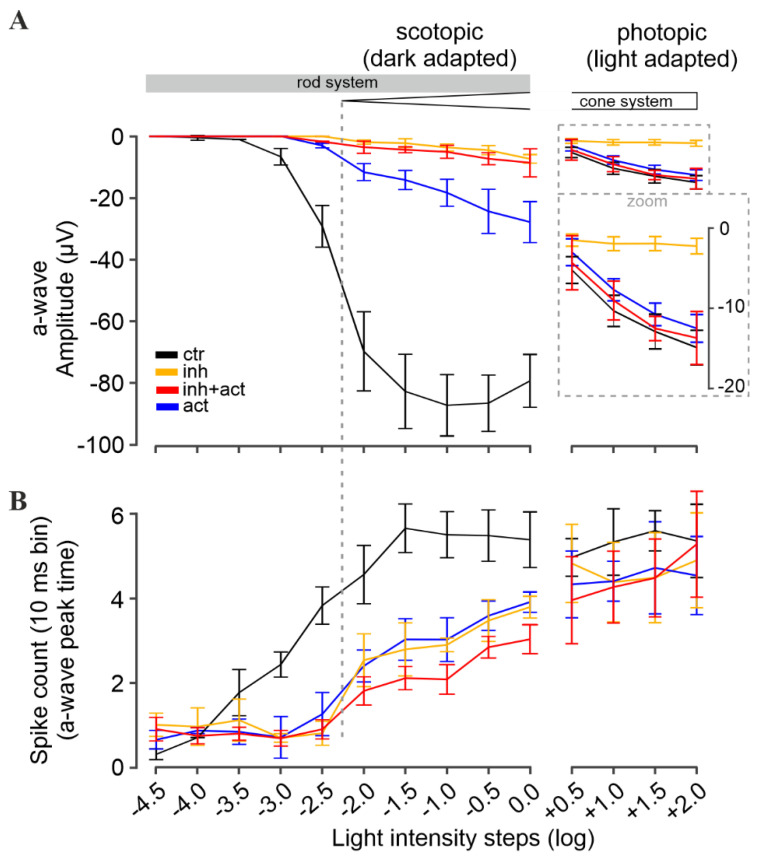
Figure 6.
Modulation of retinal light responses by cGMP analogues. Retinal function was measured under scotopic (dark-adapted, left panel) and photopic (light-adapted, right panel) conditions, reflecting rod and cone function, respectively. (A) Light-flash-mediated photoreceptor responses shown as a-wave peak amplitudes, and (B) correlated retinal ganglion cell spike responses shown as counts per 10 ms bin. Experimental conditions: control (black), inhibitor (Rp-8-Br-PET-cGMPS, 50 µM, orange), activator (8-pCPT-cGMP, 0.1 µM, blue), and inhibitor and activator co-application (red, 50 µM and 0.1 µM, respectively). n = 5 retinae for each condition. Data shown averaged from 30 MEA recording electrodes, per condition. See Figures S3 and S4 for the respective µERG trace and spike data, and Tables S2 and S3 for all values and statistical evaluation.

