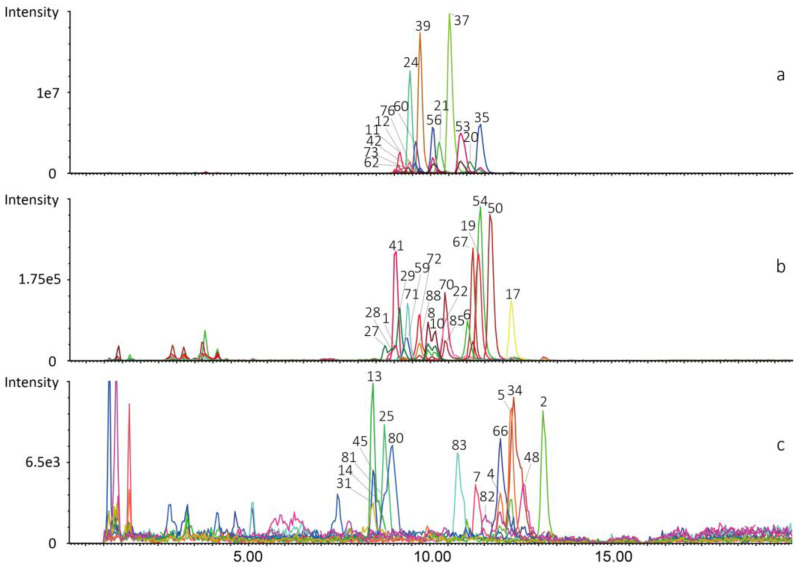
Figure 2.
Integration of individual peak in extracted ion chromatograms (EICs) of the 58 CLs in liver tissue by UPLC-QTOF-MS/MS. (a) CLs with peak intensity >1.93 × 10⁵ and <1.2 × 10⁷ cps. (b) CLs with peak intensity >1.54 × 10⁴ and <2 × 10⁵ cps. (c) CLs with peak intensity >1.46 × 10³ and <8.3 × 10³ cps. Peak numbers of compounds are consistent with those in Table S1.

