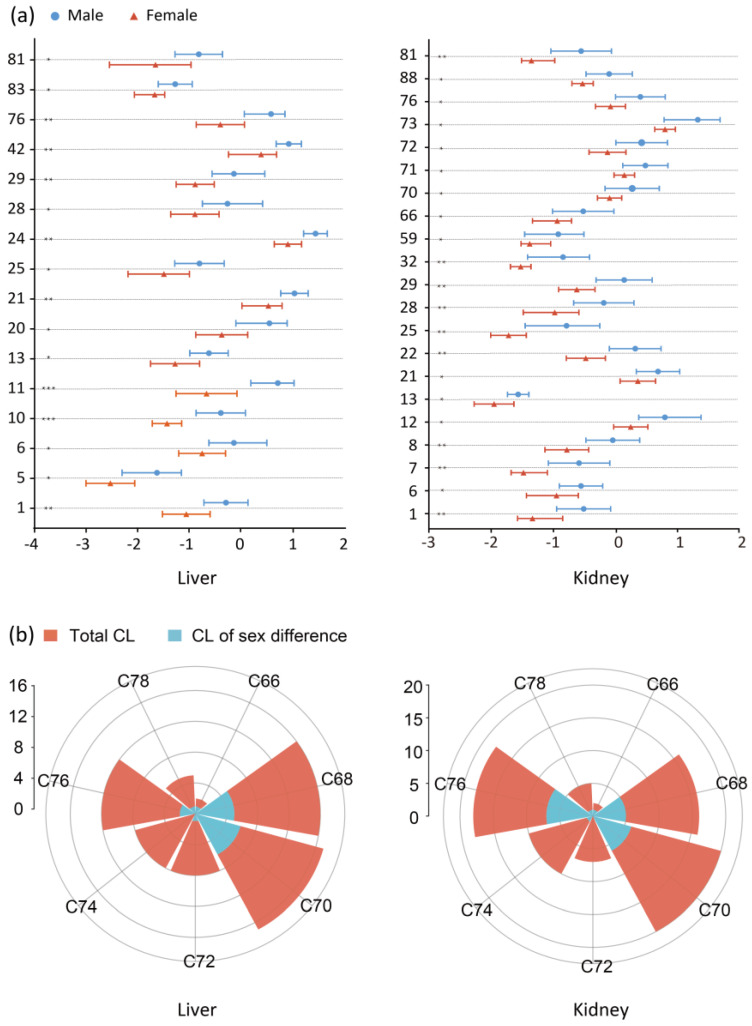
Figure 5.
(a) Relative contents of CLs detected in different sex of liver and kidney tissues. The results were presented as the mean ± SD (n = 7). * p < 0.05, ** p < 0.01, *** p < 0.001 for male vs. female. The values of each CL were the log10 logarithm transformation of their relative peak area. The numbers of compounds are consistent with those in Table 1. (b) The distributions of significant differential CLs and total CLs in tissues, stratified by the C number in liver and kidney tissues. The CLs based on the number of C atoms were divided into seven groups. The diameter is equal to the number of CLs.

