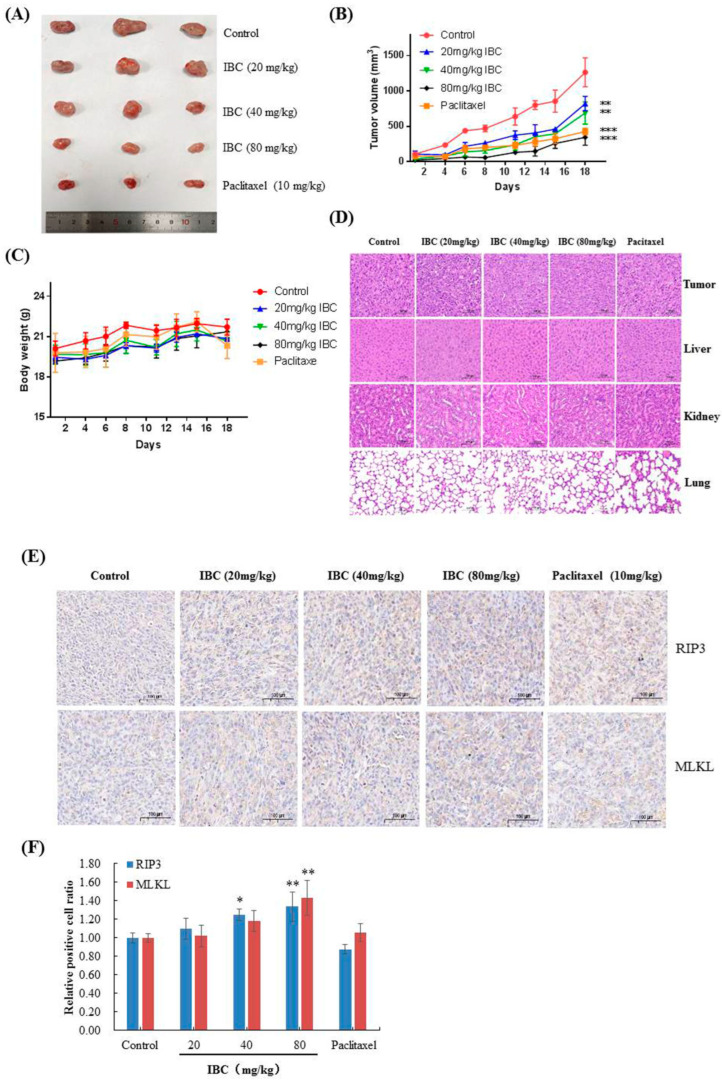
Figure 10.
Anti-tumor efficacy of IBC in MDA-MB-231 cell xenografts in nude mice (n = 3). (A) Representative tumors from each treatment group. (B) Tumor volume of each treatment group. (C) Body weight changes of nude mice. (D) H and E-stained sections of the tumor, liver, kidney, and lung from the mice after treatment with increasing doses of IBC (20, 40, and 80 mg/kg). (E) Immunohistochemistry of RIP3 and MLKL. (F) Quantification of the immunohistochemistry. * p < 0.05, ** p < 0.01, and *** p < 0.001 compared with the control.

