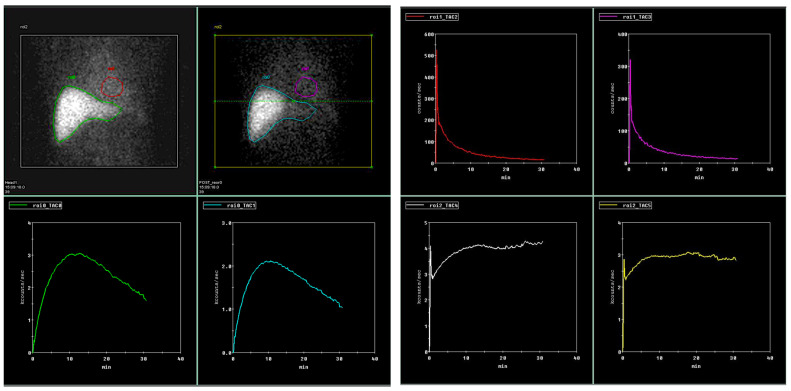
Figure 1.
Liver clearance calculations from anterior and posterior dynamic liver scans. Green/electric blue curves representing liver area, red/pink curves representing heart area as an input function and white/yellow curves representing whole field of view. Calculations were made according to Ekman et al. [27].

