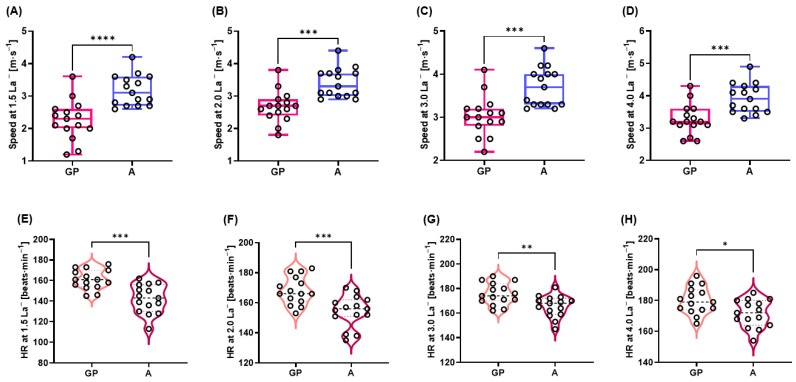
Figure 2.
Jogging/running S at (A) 1.5 mmol∙L−1 La−, (B) 2.0 mmol∙L−1 La−, (C) 3.0 mmol∙L−1 La−, (D) 4.0 mmol∙L−1 La−, HR at (E) 1.5 mmol∙L−1 La−, (F) 2.0 mmol∙L−1 La−, (G) 3.0 mmol∙L−1 La−, and (H) 4.0 mmol∙L−1 La−. * p < 0.05, ** p < 0.01, *** p < 0.001 **** p < 0.0001. A: athletes; HR: heart rate; GP: general population; S: speeds.

