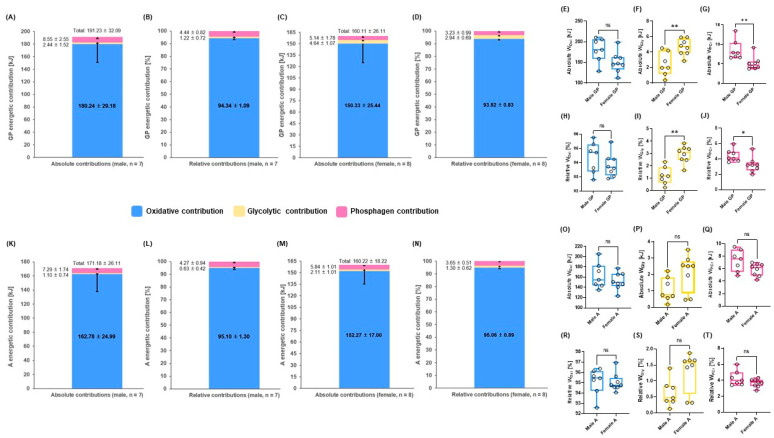
Figure 3.
Comparisons of mean energetic contributions until 3.5 m∙s−1 steps during GIET between males and females in GP and A. (A) Overview of the three energy systems in male GP (kJ), (B) in male GP (%), (C) female GP (kJ), (D) female GP (%), (E) comparison of absolute oxidative contribution (kJ) between male and female GP, (F) glycolytic contribution (kJ) between male and female GP, (G) phosphagen contribution (kJ) between male and female GP; (H) comparison of relative oxidative contribution (%) between male and female GP, (I) glycolytic contribution (%) between male and female GP, (J) phosphagen contribution (%) between male and female GP; (K) overview of the three energy systems in male A (kJ), (L) in male A (%), (M) in female A (kJ), (N) in female A (%); (O) comparison of absolute oxidative contribution (kJ) between male and female A, (P) glycolytic contribution (kJ) between male and female A, (Q) phosphagen contribution (kJ) between male and female A; (R) comparison of relative oxidative contribution (%) between male and female A, (S) glycolytic contribution (%) between male and female A, and (T) phosphagen contribution (%) between male and female A. ns: p > 0.05, * p < 0.05, ** p < 0.01. A: athletes; GP: the general population; WOxi: oxidative system contribution; WGly: glycolytic system contribution; WPCr: phosphagen system contribution. Male GP (n = 7), female GP (n = 8), male A (n =7), and female A (n = 8). Data are mean ± standard deviation (SD) (A–D and K–N).

