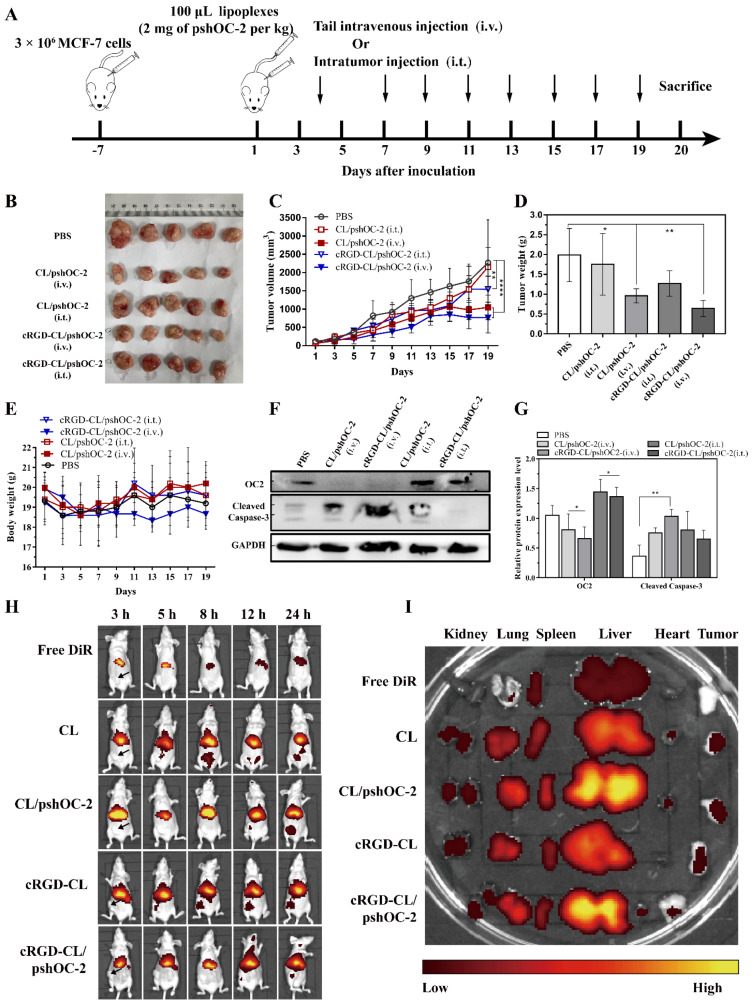
Figure 6.
Antitumor Effects of cRGD-CL/pshOC-2 Lipoplexes on Xenografts Mouse Model. (A) The schematic diagram of administration of liposomal formulation to xenografts mouse model. MCF-7 cells were subcutaneously injected into the armpit of BALB/c-nude mice (n = 5 per group). CL/pshOC-2 and cRGD-CL/pshOC-2 (2 mg of pshOC2 per kg) lipoplexes were intravenously or intratumorally injected when the xenografts reached approximately 100 mm3. Mice were sacrificed after 9 times treatment. (B) The photograph of striped tumors and statistical analyses of (C) tumor volume, (D) tumor weight and (E) body weight of each group. (F) The expression status of OC-2 and Cleaved Caspase 3 in tumor samples were analyzed by Western blot assay, with (G) statistical analysis. (H–I) Biodistribution of cRGD-CL/pshOC-2 lipoplexes in tumor-bearing mice. The tumor-bearing mice were intravenously injected with free DiR, CL, CL/pshOC-2, cRGD-CL and cRGD-CL/pshOC-2, respectively. The fluorescence intensity was detected by IVIS Imaging System. (H) In vivo imaging showing the distribution and accumulation of cRGD-CL/pshOC-2 at 3, 5, 8, 12 and 24 h. (I) Major organs and tumors were imaged 24 h after injection. Data were presented as mean ± SD, ns: No statistical difference. * p < 0.05, ** p < 0.01, **** p < 0.0001.

