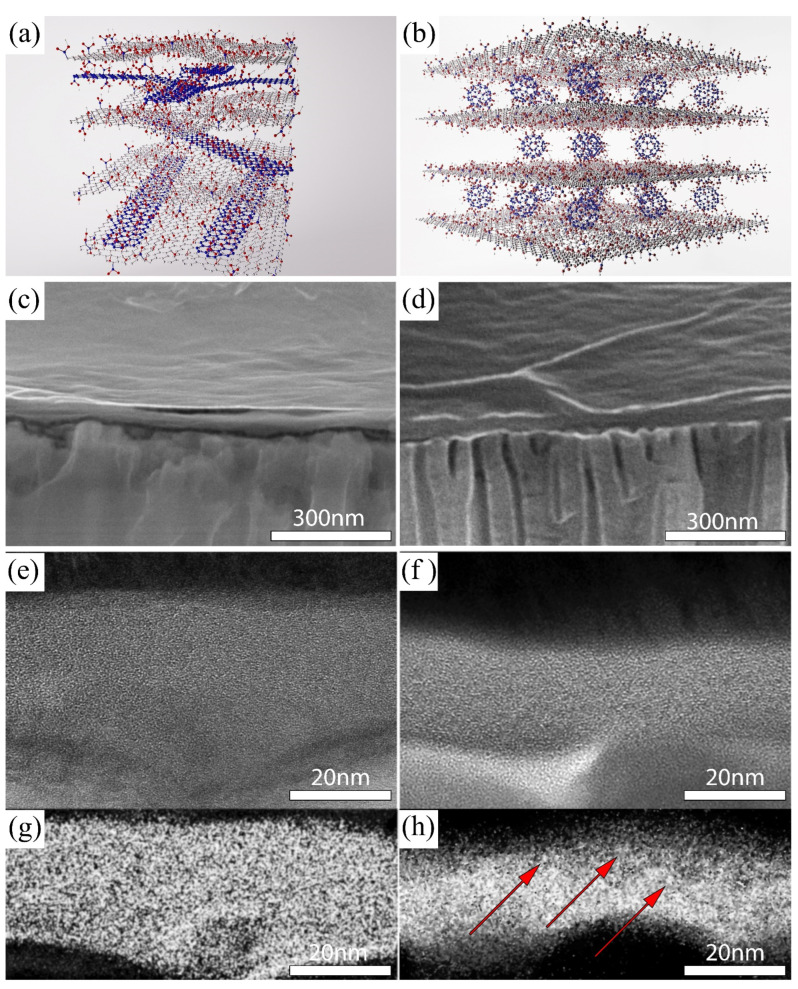
Figure 1.
Schematic representation of microstructures of composite membranes: (a) CNTGO@MFGO and (b) C60(OH)26–32@MFGO; SEM and TEM micrographs of the cross-sections of the composite membranes: (c,e) CNTGO@MFGO and (d,f) C60(OH)26–32@MFGO; energy-filtered carbon K edge images of (g) CNTGO@MFGO and (h) C60(OH)26–32@MFGO samples. Due to an increased local atomic density of carbon atoms in fullerenols (>80 atoms/nm3) compared to GO (~50 atoms/nm3), they are seen on C1s EFTEM as brighter spots and inhomogeneities. Red arrows in (h) indicate the possible location of fullerenol inclusions.

