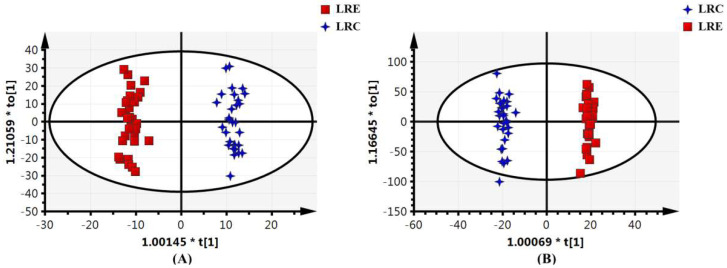
Figure 2.
Scores plot from the orthogonal projections to latent structures discriminant analysis of the global metabolome in the LRC and LRE group (A) in the positive ionization mode; (B) in the negative ionization mode. Blue crosses represent LRC group. Red squares represent LRE group. Their spatial distribution reveals the variations of the metabolic profiles between the two groups. The two groups exhibit a clear separation, indicating that there are distinct differences in the global metabolic profiles between the two groups. LRC, centenarians in the longevous region; LRE, elderly people aged 60–70 years in the longevous region.

