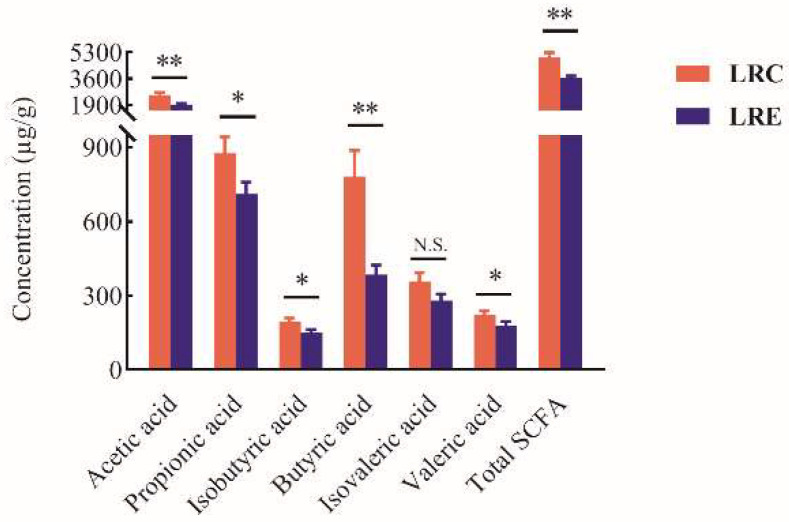
Figure 6.
SCFAs in feces in the LRC group and LRE group. Data are shown as mean ± SEM. Asterisks designate significance by Student’s t-test. * p < 0.05, ** p < 0.01. N.S. denotes that there is no significant difference between the two groups. The concentrations of acetic acid, propionic acid, isobutyric acid, butyric acid, valeric acid, and total SCFA in the LRC group were significantly higher than those in the LRE group (p < 0.05), reflecting the unique remodeling of SCFA metabolism in the LRC group. LRC, centenarians in the longevous region; LRE, elderly people aged 60–70 years in the longevous region.

