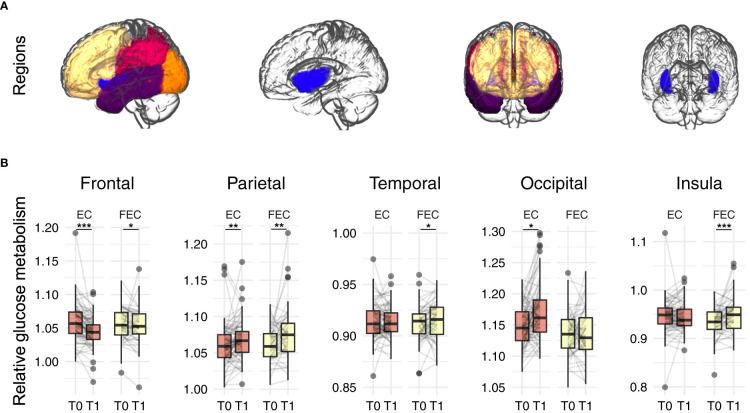
Figure 2.
Regions of interest analysis of relative glucose metabolism before (T0) and after (T1) neo-adjuvant chemotherapy. (A) regions of interest: frontal (yellow), parietal (red), occipital (orange), temporal (purple) and insular (blue) cortex. (B) Robust mixed effects modelling showed relative decreases in frontal glucose metabolism, while increases where observed for parietal for both EC (n=100) and FEC (n=83) treated patients. Additionally, relative increased temporal and insular metabolism was observed for FEC treated patients and increased occipital metabolism for EC patients. Models were corrected for age, type of scanner and years since chemotherapy. P-values were Benjamini-Hochberg corrected for comparing five outcomes. EC = 4 rounds of epirubicin 90 mg/m2 + cyclophosphamide 600 mg/m2; FEC = 3-6 rounds of 500 mg/m2 5-fluorouracil and 4 rounds of epirubicin 100 mg/m2 + cyclophosphamide 500 mg/m2. *pFDR<0.05, **pFDR<0.01, ***pFDR<0.001.

