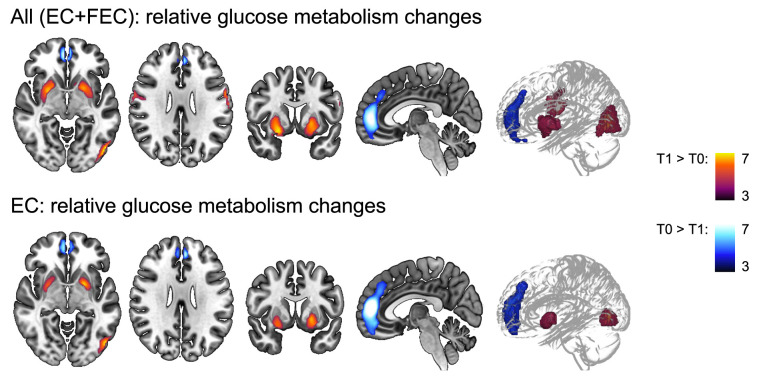
Figure 3.
Whole-brain voxel-based analysis of relative glucose metabolism before (T0) and after (T1) neo-adjuvant chemotherapy. General linear modelling showed relative decreased (blue colored T-scale, paracingulate gyrus) and increased (red colored T-scale) frontal (central gyrus) glucose metabolism, as well as increased subcortical (putamen and occipital (lateral cortex) metabolism for EC and FEC treated patients combined. Except for the pericentral gyri decrease, the same regions showed changes in relative metabolism for EC patients separately, but not FEC patients. Models were corrected for age and type of scanner (n=282) scans. Statistical significance was inferred with a height threshold of pFWE<.05 and a cluster-level pFWE<.001. EC = 4 rounds of epirubicin 90 mg/m2 + cyclophosphamide 600 mg/m2; FEC = 3-6 rounds of 500 mg/m2 5-fluorouracil and 4 rounds of epirubicin 100 mg/m2 + cyclophosphamide 500 mg/m2.

