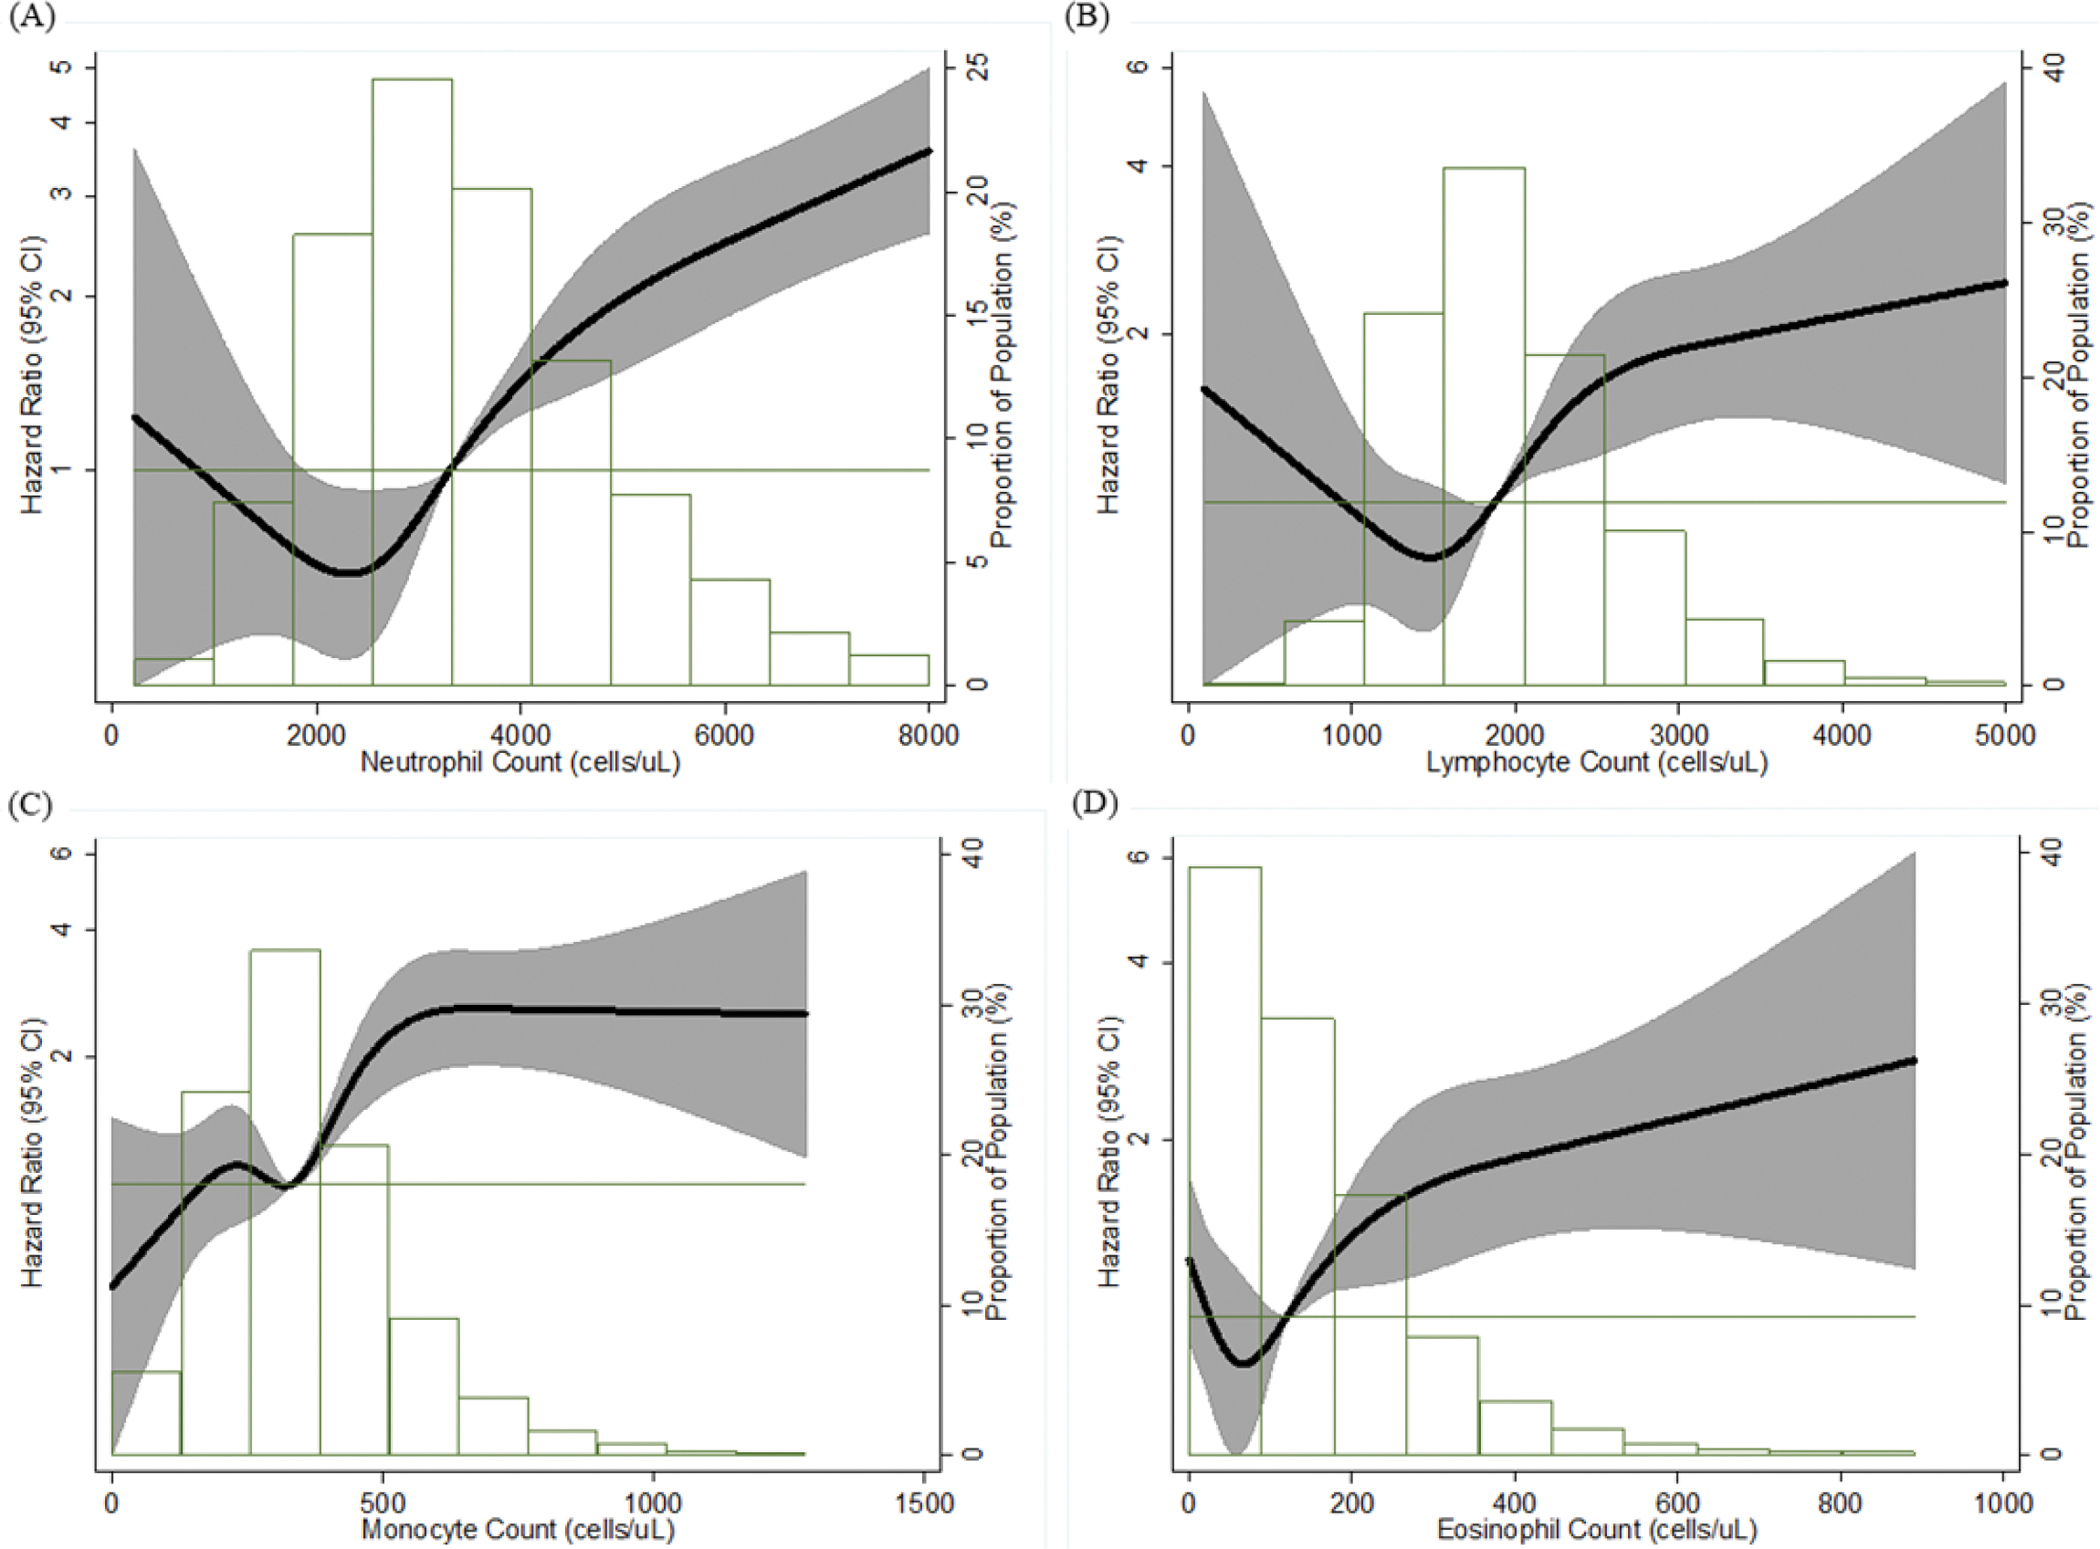
Figure 2.

Association Between Each Differential Leukocyte Count and Incident AAA Presented as Hazard Ratio (Solid Line) and 95% Confidence Intervals (Shaded Area), Atherosclerosis Risk in Communities Study, 1987 – 2011.
(A) Neutrophil Count; (B) Lymphocyte Count; (C) Monocyte Count; (D) Eosinophil Count. Cox proportional hazards model using restricted cubic splines with knots at the 5th, 27.5th, 50th, 72.5th and 95th percentiles and adjustment for age, race, and sex. The reference is the median value of each differential leukocyte count (hazard ratio = 1), and the histogram represents the frequency distribution of each differential leukocyte count in the study sample. AAA = abdominal aortic aneurysm
