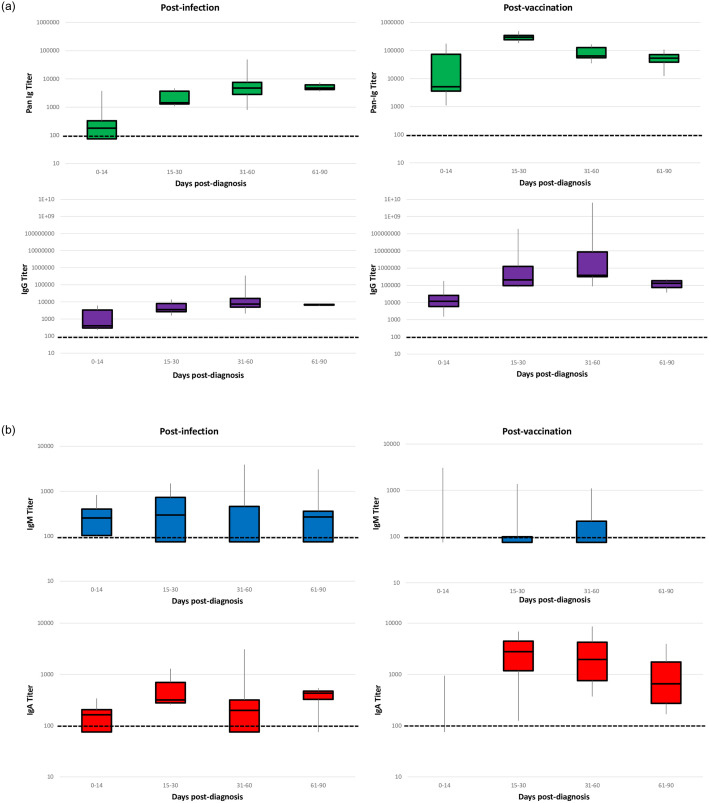
Fig 2. Distribution of anti–SARS-CoV-2 serum antibody titers by isotype and time period among participants (N = 11) in a nursing home cohort—Georgia, October 2020‒April 2021.
The post-infection period was defined as the time from SARS-CoV-2 diagnosis (by BinaxNOW™ COVID-19 Ag Cards and/or real-time reverse transcription polymerase chain reaction) to receipt of first Pfizer-BioNTech COVID-19 Vaccine dose. The post-vaccination period was defined as the time after receipt of first vaccine dose to the end of the evaluation period. Participant G was not included in the post-infection analyses because they did not provide blood specimens during this time period. Participant C was not included in the post-vaccination analyses due to vaccination refusal. Participants with serum antibody titers below the seroconversion threshold (defined as a signal threshold >1 at the 1:100 dilution for any isotype) were assigned a value of 25 for graphical representation only. In each box and whisker plot, the horizontal line represents the median, and the top and bottom of the box the interquartile range, and the whiskers the minimum and maximum values. The y-axis is plotted in logarithmic scale. Only three observations were above the limit of detection during 0–14 days post-vaccination for IgM and IgA; IgM titers during this time period ranged from 313–3013 and IgA titers ranged from 177–890.

