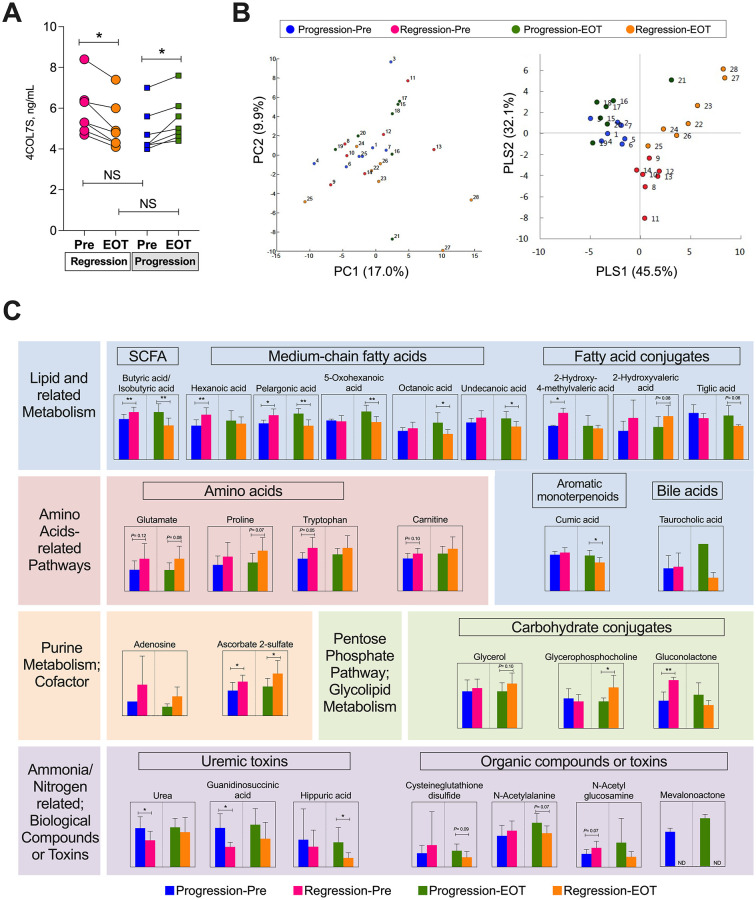
Fig 4. Metabolomic analysis using CE-TOFMS in patients with 4COL7S-defined fibrosis progression or regression from pre-treatment to end of treatment (exploratory analysis 2).
(A) Seven patients with 4COL7S-defined fibrosis progression at the EOT and another background characteristic-matched seven patients with fibrosis regression are analyzed. Serum levels of 4COL7S before treatment and at EOT are shown. (B) A principal component analysis (PCA) plot (left) and plot generated from a discriminant analysis of a partial least square method (PLS-DA; right) derived from metabolomic analysis using CE-TOFMS of paired serum samples before treatment (Pre) and at EOT of both groups are shown. Each number label indicates an individual sample. (C) Twenty-seven metabolites demonstrating tendencies of differences (P ≤ 0.10) or substantial ratios of differences (relative concentration ratio >2.0) between fibrosis progression and regression groups at Pre or at EOT are shown. Data are shown as averages with standard deviations. *P < 0.05, **P < 0.01. NS, not significant; ND, not detected.

