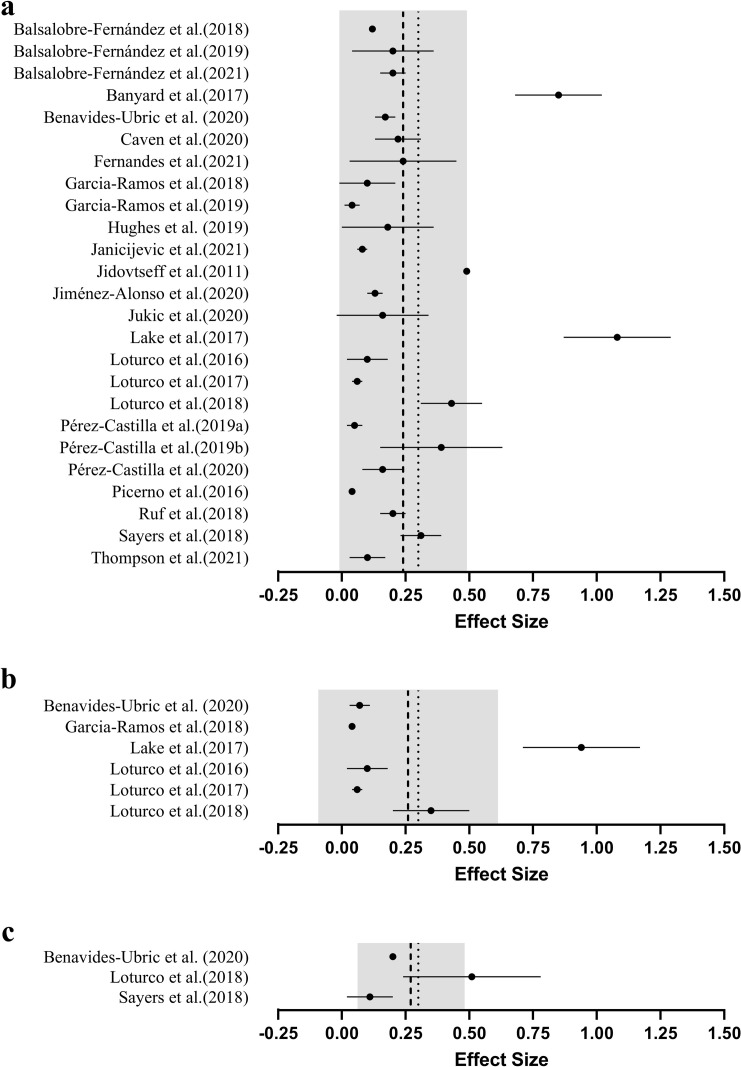
Fig 5.
Mean (●) effect sizes (±SD), grouped average (---) and recommended maximum effect size (∙∙∙) for magnitude of difference between predicted and actual 1RM by velocity metric used for maximal strength prediction; a.) mean concentric velocity, b.) mean propulsive velocity, c.) peak concentric velocity. The grey band represents the standard deviation of the pooled effect sizes. Note: Effect sizes closer to zero indicate greater validity (i.e., smaller difference between actual and predicted 1RM).

