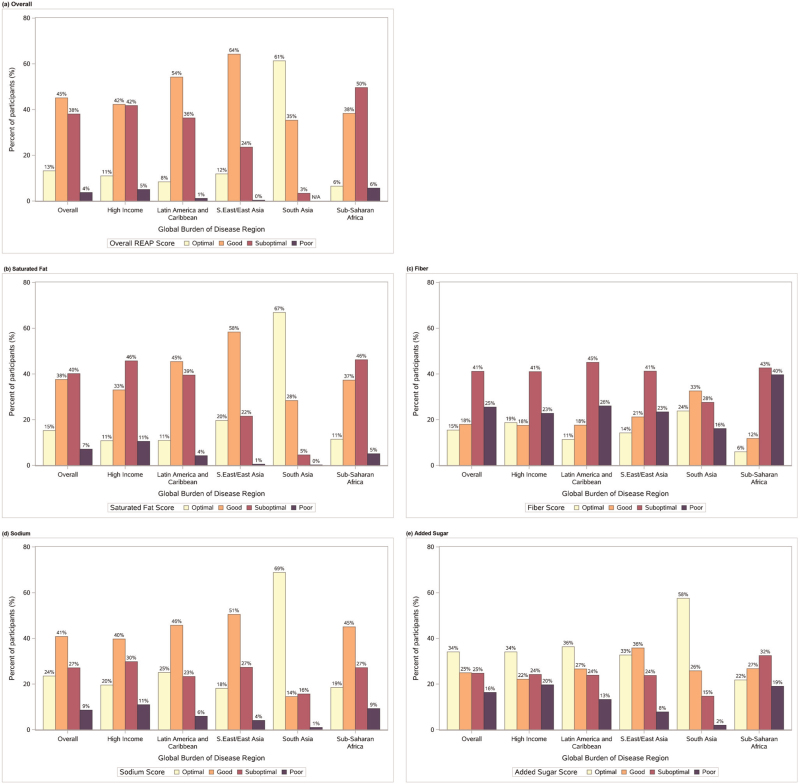
Fig. 1.
Diet quality score and diet component scores by global burden of disease region.
Distribution of diet quality score by global burden of disease region. Score categorizations are as follows: max score = 30; optimal 22.5–30; good 15 < to <22.5; suboptimal 7.5 < to ≤15; poor 0–7.5. Distribution of diet component scores by global burden of disease region; component score for (a) saturated fat, (b) fiber, (c) sodium, (d) added sugar. Categorization of component scores is as follows: saturated fat: max score = 18; optimal greater than 13.5; good 9 < to ≤13.5; suboptimal 4.5 < to ≤9; poor 4.5 or less; fiber: max score = 6; optimal greater than 4.5; good 3 < to ≤ 4.5; suboptimal 1.5 < to ≤3; poor 1.5 or less; sodium: max score = 8; optimal greater than 6; good 4 < to ≤ 6; suboptimal 2 < to ≤ 4; poor 2 or less; added sugar: max score = 4; optimal greater than 3; good 2 < to ≤ 3; suboptimal 1 < to ≤ 2; poor 1 or less.

