Figure 5.
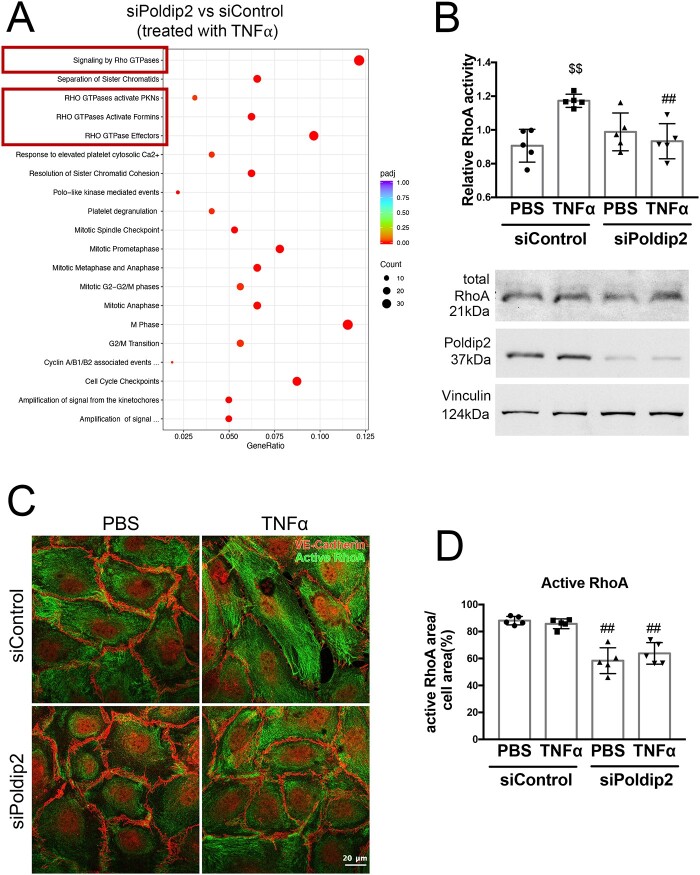
Poldip2 knock-down alters RhoA activity and localization. (A) Reactome analysis of RNASeq data showing the most highly significantly affected pathways when comparing siPoldip2 vs. siControl treated HLMECs after TNFα treatment (Rho GTPase pathways are highlighted in the red boxes) (n = 3). (B) TNFα treatment induced RhoA activity in siControl but not in siPoldip2 treated RBMECs, as measured in G-LISA assays. The graph represents averages ± SEM (n = 5), $$P < 0.01 compared to PBS siControl treated cells, ##P < 0.01 compared to TNFα and siControl treated cells (two-way ANOVA, with Tukey’s correction). Representative western blot showing unchanged total RhoA protein expression and efficiency of Poldip2 knock-down. Vinculin served as a loading control (see Supplementary material online, Figure S4 for Western blot quantification). (C) Immunofluorescence assay of active-RhoA, shown as green staining. Active-RhoA was localized to the entire cell area in siControl treated HLMECs with siPoldip2 shifting active-RhoA staining centrally. VE-cadherin staining (red) detects cell junctions. Images quantified in (D) represent averages ± SEM (n = 5), ##P < 0.01 compared to corresponding siControl treated cells (two-way ANOVA, with Tukey’s correction).

