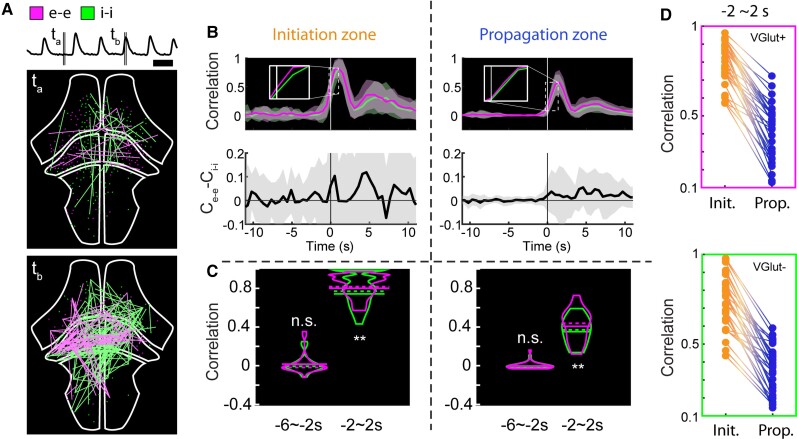
Figure 6.
Excitatory and inhibitory cell network correlations. (A) Visualization of activity correlations at the cross-section of the whole brain. Only pairs with correlation values higher than 0.999 are shown. Top: Average normalized fluorescence trace. Middle: Correlations during interictal period. Magenta: Highly correlated excitatory cell pairs (e-e); green: inhibitory cell pairs (i-i). Bottom: Correlations during ictal period. Scale bar = 20 s. (B) Average trends of interictal to ictal transition for the initiation and propagation zones. Top: Correlation metric calculated over 1.5 s-wide rolling window (magenta: e-e; green: i-i). Bottom: Difference of e-e and i-i correlations. (C) Correlation metric values of i-i pairs and e-e pairs shown separately for −6∼−2 s and −2∼2 s periods relative to the average ictal onset point. (D) Within-seizure correlations of e-e cell pairs (top) and i-i cell pairs (bottom) between initiation and propagation zones.

