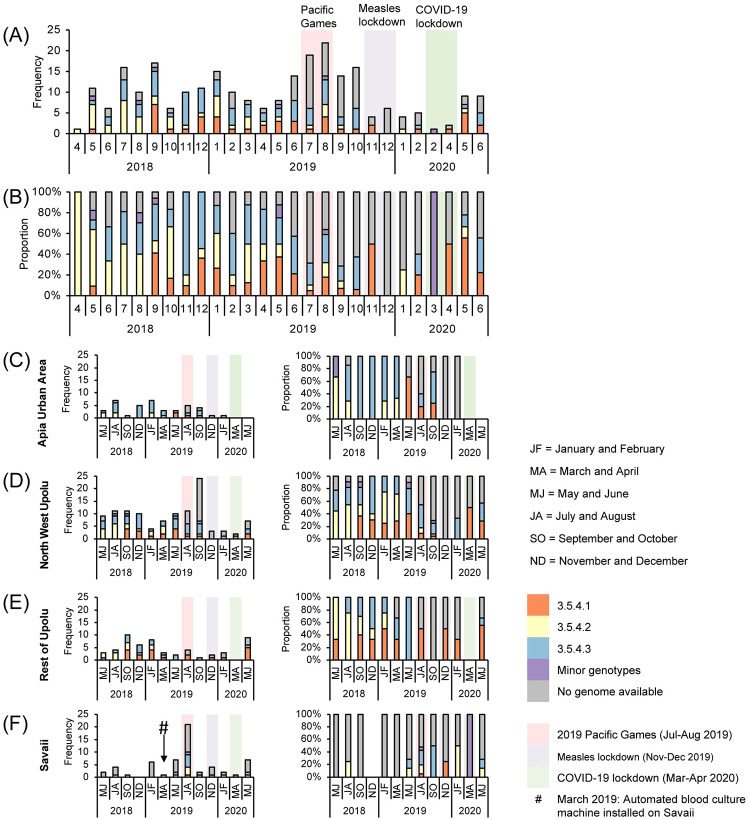
Fig 4. Bar graphs depicting the number and proportion of blood culture-confirmed cases of typhoid fever in Samoa over time from April 27, 2018 through June 9, 2020 by genotype/sub-lineage.
(A-B) The frequency and proportion of acute cases (N = 260) occurring each month are colored by genotype/sub-lineage (n = 172) or greyed if no genome was available (n = 88). Genotype 3.5.4 sub-lineages 1–3, comprising a total of 166/172 sequenced isolates from acute cases, are identified as orange, yellow, and blue bars, respectively. Minor genotypes (purple bar) include genotype 4.1 (4/186), genotype 3.5.3 (1/186), and one genotype 3.5.4 outlier (1/186) that did not fall into one of the three sub-lineages. (C-F) The frequency and proportion of acute cases occurring over 2-month intervals in each census region. Three major events impacting population mobility–increases during the 2019 Pacific Games in Nov-Dec 2019, and restrictions during the measles lockdown from Nov-Dec 2019 [35] and COVID-19 lockdown from Mar-Apr 2020 [36]–are labeled as light red, light purple, and light green background colors, respectively, over the two-month time intervals affected.

