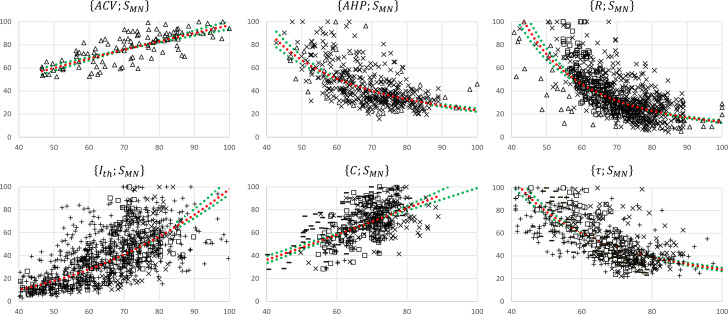
Figure 4. Normalized motoneuron (MN) size-related final datasets.
These were obtained from the 19 studies reporting cat data that concurrently measured at least two of the morphometric and electrophysiological properties listed in Table 1. For each pair, the property is read on the y-axis and on the x-axis. The power trendlines (red dotted curves) are fitted to each dataset and are reported in Table 3. The 95% confidence interval of the regression is also displayed for each dataset (green dotted lines). For each plot, the constitutive sub-datasets that were obtained from different global datasets are specified with the following symbols identifying the property : , , □, , and .

