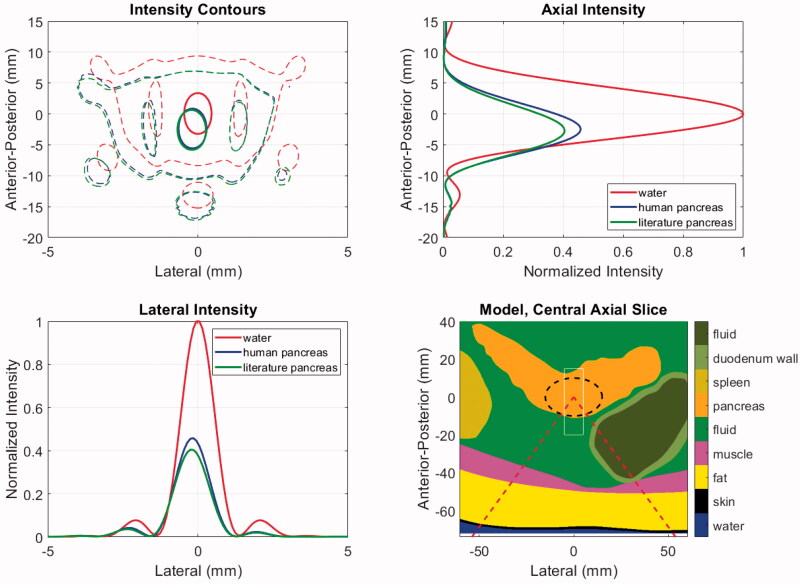
Figure 6.
Acoustic intensities for patient model M1 using literature and newly acquired human pancreas acoustic properties. The model geometry (lower right) shows the distribution of tissues and includes the ‘cone’ of the incident HIFU beam (dashed red), the PDAC target (dashed black) and the window in which intensities are displayed in the other panels (thin white). The intensities are shown in the central axial plane of the model (upper left) at levels of 0.7 (thick solid) and 0.033 (thin dashed) relative to the maximum. Axial (upper right) and lateral (lower left) intensity profiles are shown at the level of each model’s maximum value.

