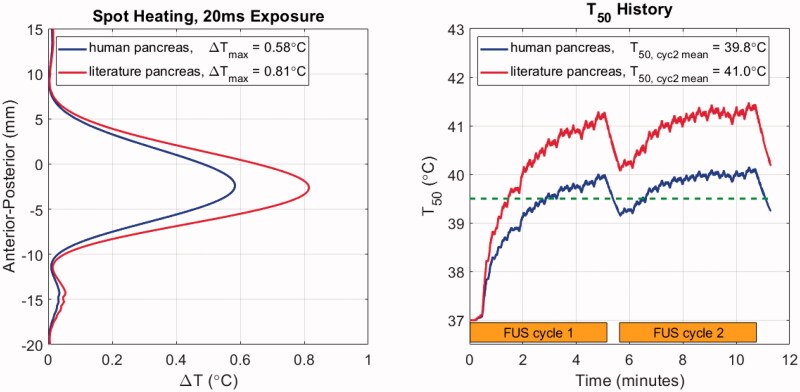
Figure 7.
Temperature elevation simulation results with patient model M1 using literature and newly acquired human pancreas acoustic properties. Left: Anterior-posterior (depth) temperature distribution in the lateral center of the target after 20 ms of exposure, with the peak values listed in the legend. Right: T50 histories over two treatment cycles indicated by orange bars. Cycle-2 mean T50 values are listed in the legend. The dashed green line indicates the threshold temperature for drug release from ThermoDox™.

