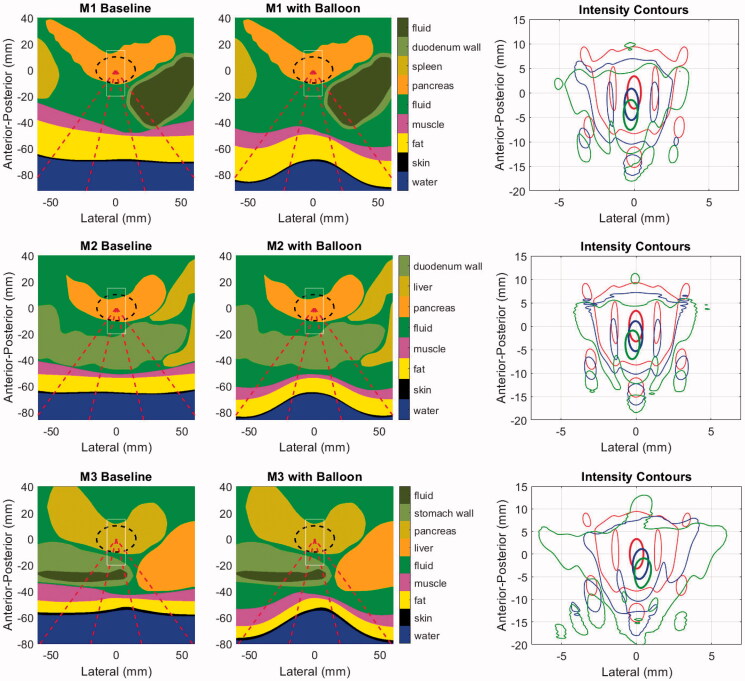
Figure 8.
Geometries for the baseline (left) and balloon-deformed (center) configurations of each patient model. Overlaid lines indicated the annular ‘cone’ of the incident HIFU beam (dashed red), the PDAC target (dashed black) and the window in which intensities are displayed in the right-side panels (thin white). Intensity contours at 0.7 (thick line) and 0.033 (thin line) are overlaid in the same central axial plane of the models as displayed in the left and center panels, with colors denoting an idealized water path (red), baseline tissue (blue) and balloon-deformed tissue (green). Upper row: M1 (70 mm target depth), Middle row: M2 (66 mm target depth), Lower row: M3 (55 mm target depth).

