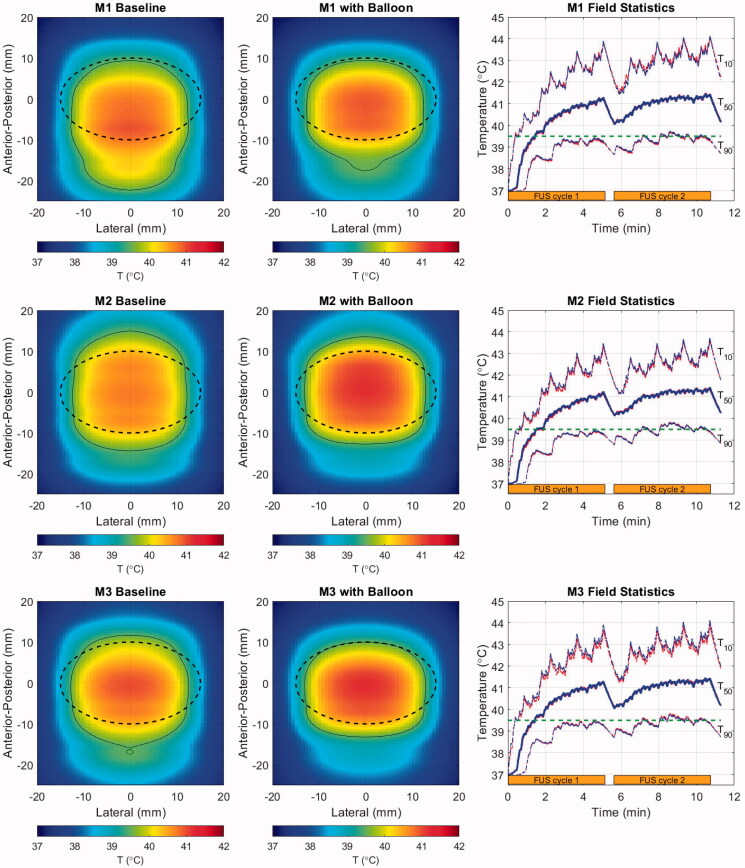
Figure 9.
Cycle-2 time-averaged temperature maps projected in the lateral-A-P plane for the baseline (left) and balloon-deformed (center) configurations of each patient model, and histories (right) for T50 (thick line) and T10/T90 (thin lines) spanning two treatment cycles (orange bars). In the temperature maps, overlaid lines indicate the PDAC target (dashed black) and the 39.5 °C iso-contour (thin black). Colors in the field statistics denote the baseline (red), and balloon-deformed tissue (blue). Upper row: M1 (70 mm target depth), Middle row: M2 (66 mm target depth), Lower row: M3 (55 mm target depth).

