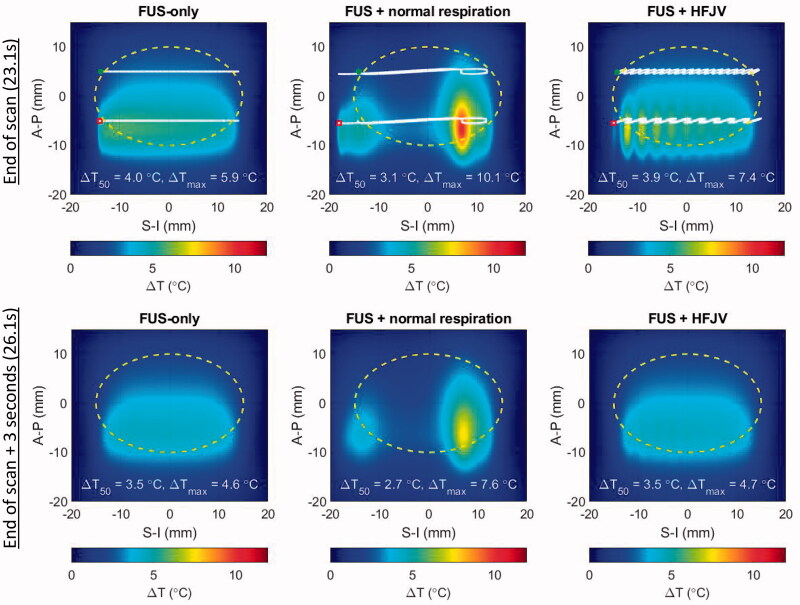
Figure 11.
Temperature elevations for patient model M1 after a full slice moving beam scan (upper row) and 3 s after the end of the scan (lower row). left: no respiratory motion, center: normal respiratory motion, right: HFJV. In each panel, the coordinate system is referenced to the pancreas target center, the white line indicates the net trajectory of the HIFU beam, and the yellow dashed line encircles the treatment ‘slice’. The trajectory start and end points for the full slice treatment are indicated with green and red marks, respectively.

