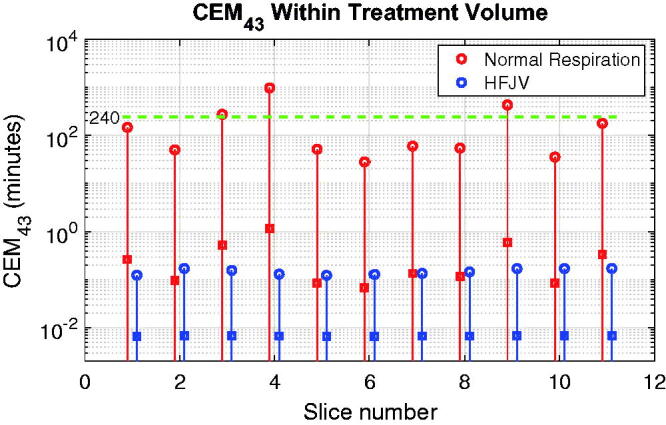
Figure 12.

CEM43 values for each treatment slice of the standard target used in this study. Solid lines span the full range of values in each slice, and the peak and mean values are indicated by open circles and square symbols, respectively. The green dashed horizontal line denotes the critical value of 240 min.
