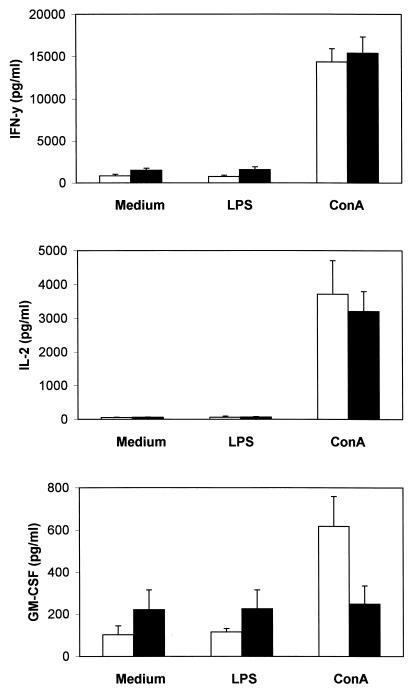
FIG. 3.
Cytokine production by splenocytes from EPS-treated mice. Each mouse received a single intraperitoneal injection of EPS (10 mg per kg of body weight) 1 day before the assay. Spleen cells from control mice (open bars) and EPS-treated mice (solid bars) were stimulated in vitro with LPS or ConA, and the cytokine levels in the supernatants were measured by specific immunoassays. Results are means for five mice and are representative of two separate experiments. Error bars represent standard deviations. IFN-y, IFN-γ.

