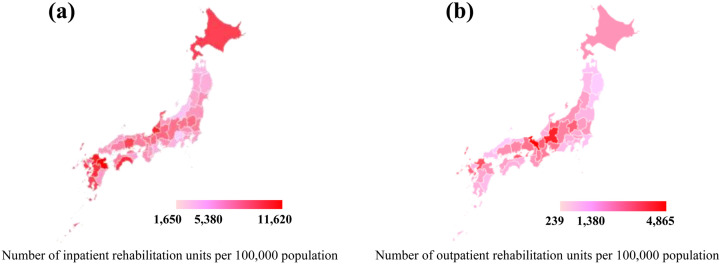
Figure 2.
Geographic distribution of the numbers of inpatient and outpatient rehabilitation units per 100,000 population in 47 prefectures.
(a, b) Distributions of the numbers of inpatient and outpatient rehabilitation units per 100,000 population in 47 prefectures, respectively. Pink to red colors: minimum to maximum. Middle value: median.

