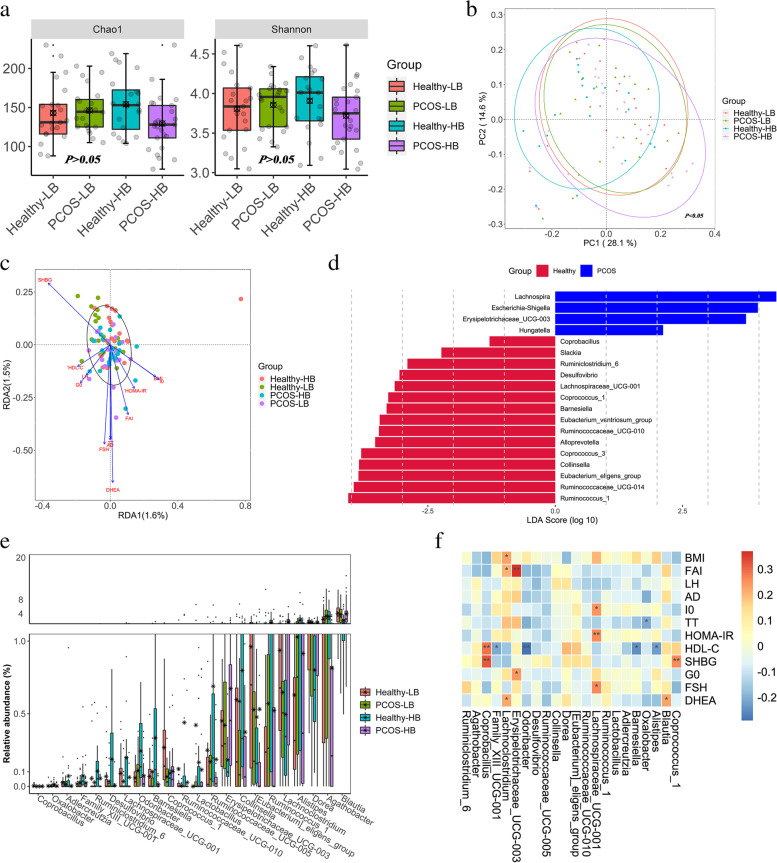
Fig. 2.
Fecal bacterial characteristic variations associated with PCOS. a α diversity. p values denote the significance among groups. Letters indicate ANOVA grouping. b Differences in bacterial structures as revealed by PCoA analysis. c RDA analyses reflecting differences in gut microbiota structures fitted with significantly correlated clinical properties. d Characteristic bacterial taxa based on LDA effect size (LEfSe) analysis between PCOS patients and healthy individuals. e The distinguished bacterial genera screened by Kruskal–Wallis tests. f The heatmap depicts the relationship between distinguished bacterial genera (screened by Kruskal–Wallis tests) and key clinical parameters

