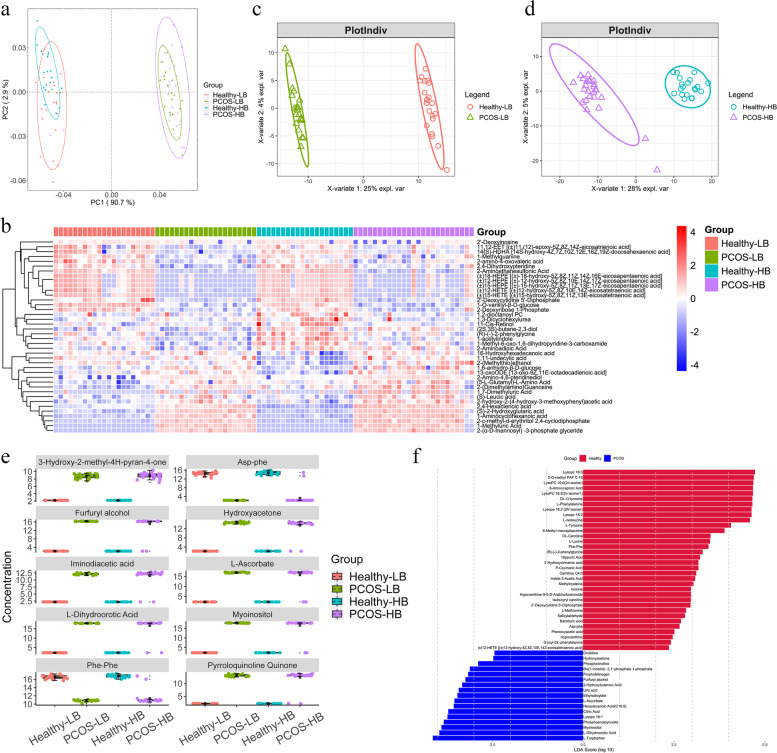
Fig. 4.
Serum metabolite variations associated with PCOS. a Differences in fungal structures as revealed by PCoA analysis. b Heatmap showing the relative abundance of the 40 metabolites screened by Kruskal–Wallis tests. c PLS-DA plot revealing the differential metabolite pattern between Healthy-LB and PCOS-LB. d PLS-DA plot revealing the differential metabolite pattern between Healthy-HB and PCOS-HB. e The distribution of the top 10 metabolites as VIP values ranked as shared by comparison between Healthy-LB and PCOS-LB and between Healthy-HB and PCOS-HB. f Characteristic metabolites based on LDA effect size (LEfSe) analysis between PCOS patients and healthy controls

