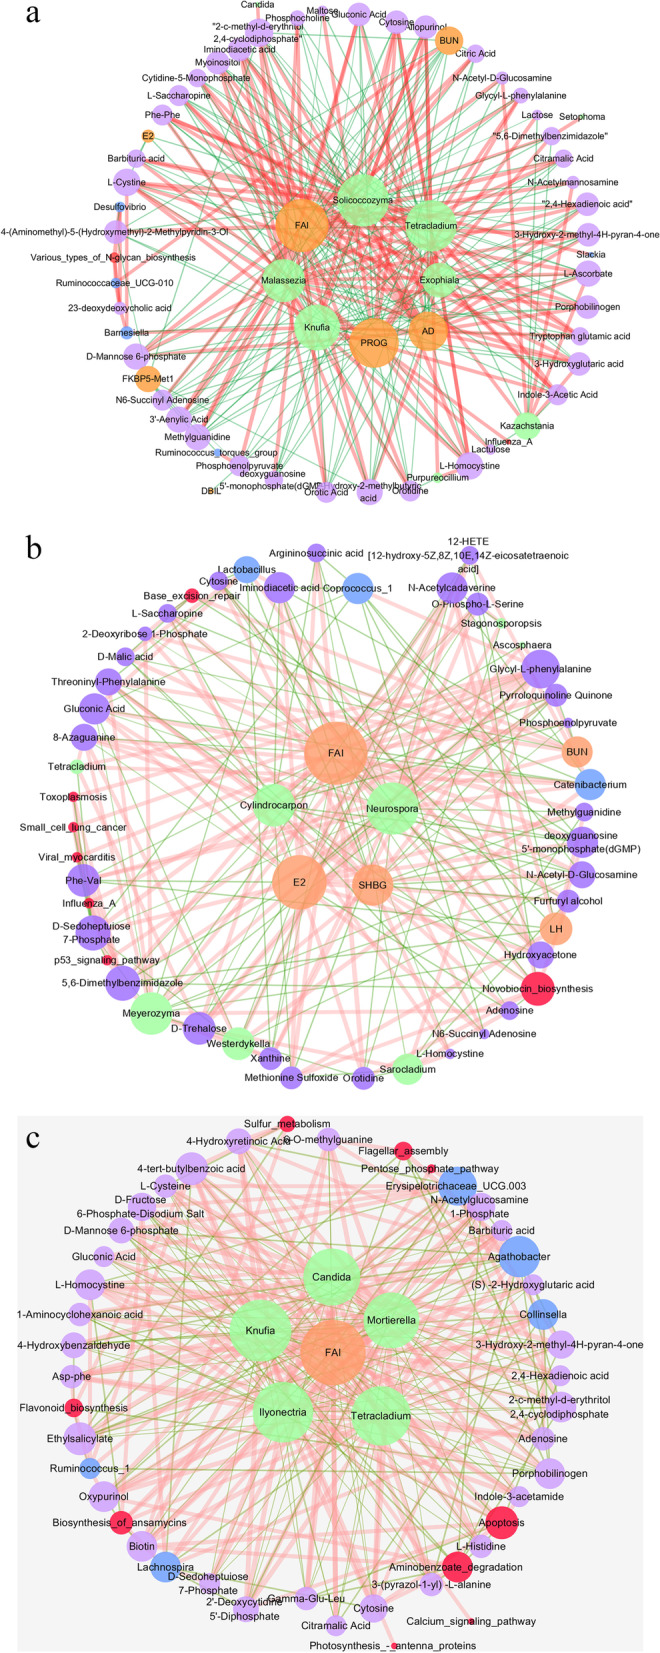
Fig. 6.

Integrative co-occurrence network reflecting multiomic-phenotype interactions. (a,b,c) Network revealed both significant (p < 0.05) and suggestive correlations (∣r∣ > 0.4, Spearman analysis) between differentially abundant bacterial, fungal, predicted pathway, metabolites and clinical indices in PCOS and healthy, PCOS-LB and Healthy-LB, PCOS-HB and Healthy-HB. Nodes represent characteristics. Purple, blue, red, green and yellow nodes denote metabolites, bacterial taxa, predicted pathways, fungal taxa and clinical parameters. Lines connecting nodes indicate positive (red) or negative (green) correlations
