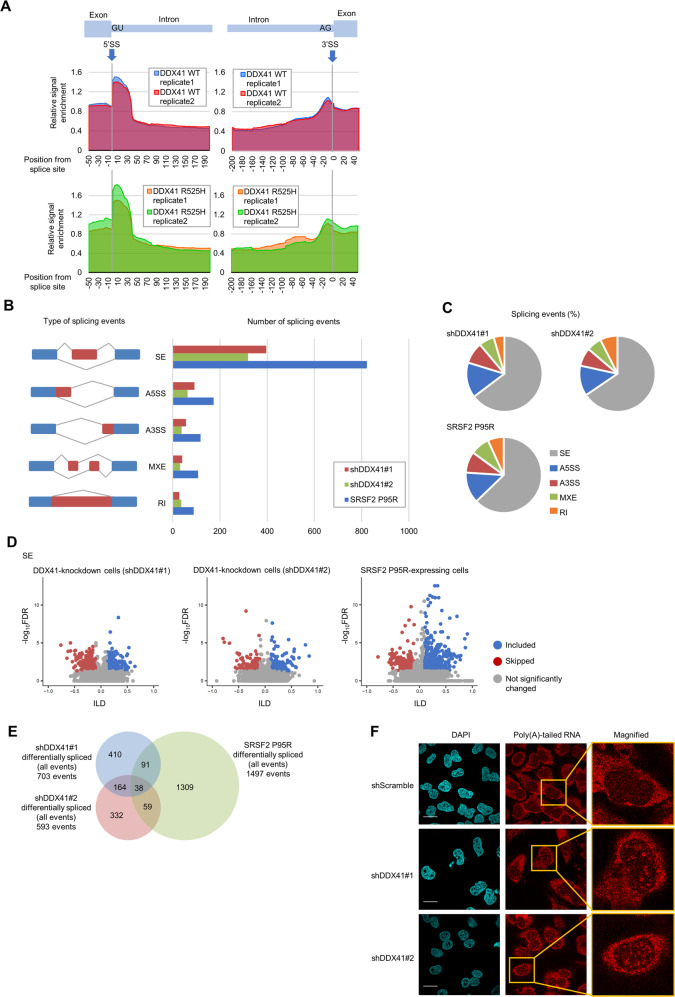
Fig. 1. DDX41 is involved in RNA splicing by binding to 5’SS but does not play a major role in SS recognition.
A Relative CLIP-seq signals at 5ʹSS and 3ʹSS on coding RNA. Vertical axis: ratio of CLIP sample signal divided by that of input RNA from same cells. Blue and red lines in top panels indicate relative signal enrichment of CLIP reads from cells expressing Myc-tagged WT DDX41; green and orange lines in bottom panels indicate reads from cells expressing Myc-tagged R525H mutant DDX41. B Quantification of RNA splicing changes in K562 cells expressing shDDX41#1, shDDX41#2, or SRSF2 P95R. We placed splicing events into groups according to rMATS: (1) skipped exon (SE), (2) alternative 5ʹSS (A5SS), (3) alternative 3ʹSS (A3SS), (4) mutually exclusive exons (MXE), and (5) retained intron (RI). Cumulative number of events in each cell group with an inclusion level difference (ILD) > 0.1 or <−0.1 and a false discovery rate (FDR) <0.05 are shown. C Distribution of RNA splicing events in K562 cells expressing shDDX41#1, shDDX41#2, or SRSF2 P95R compared with control K562 cells. Splicing events were categorized as in B. D Changes in RNA splicing events for SE in DDX41-knockdown cells and SRSF2 P95R-expressing cells. We included splicing events with 10% minimum change of absolute percent spliced-in index (PSI, which indicates rate of incorporation of specific exon into transcript of a gene) (delta PSI ≥ 0.1) and average reads ≥5; those with FDR < 0.05 with ILD < 0.1 or >0.1 in each group were considered significant and plotted with red or blue dots, respectively. Gray dots are not significant. E Overlap of RNA splicing events among DDX41-knockdown cells and SRSF2 P95R-expressing cells. All significant RNA splicing events (SE, MXE, RI, A5SS, and A3SS) in each cell type were summed, and event overlap among DDX41-knockdown cells and SRSF2 P95R-expressing cells is shown. F Subcellular distribution of poly(A)-tailed RNA in DDX41-knockdown cells. Scale bars: 20 μm.

