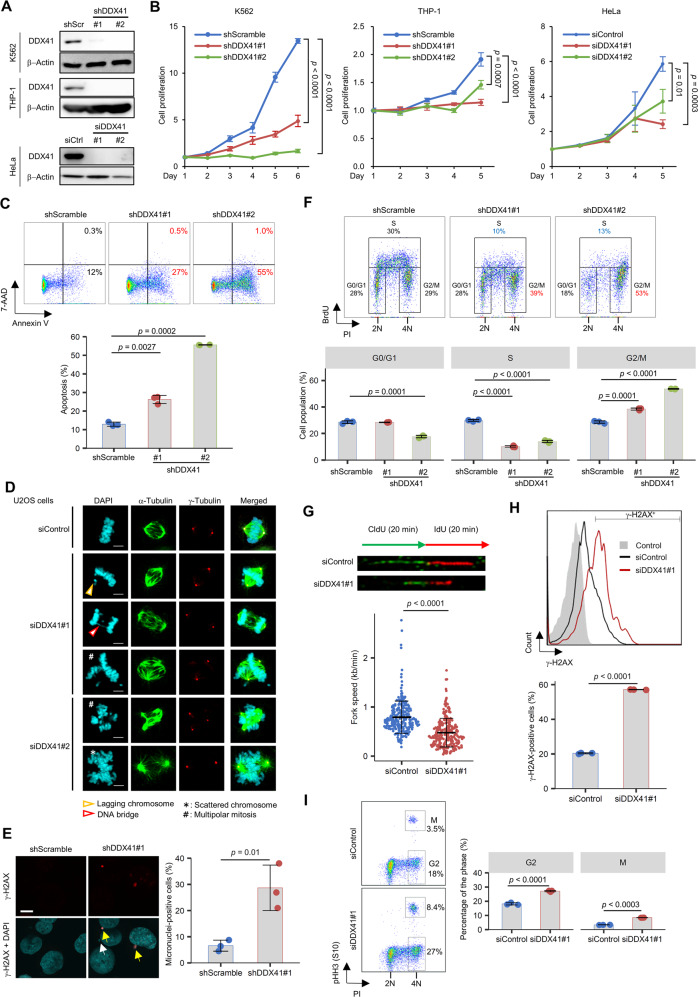
Fig. 3. DDX41-knockdown induces impaired DNA replication and abnormal mitosis.
A Inhibition of DDX41 expression by siRNA/shRNA against DDX41. shScr, shScramble; siCtrl, siControl. B Suppression of cell growth by DDX41 knockdown. Cells were transfected with the indicated shRNAs (K562 and THP-1 cells) or siRNAs (HeLa cells). Day 1 means day 4 after lentivirus infection (K562 and THP-1 cells; n = 4) or the day of siRNA transfection (HeLa cells; n = 3). Values are means ± SD; two-tailed unpaired Student’s t test. C Induction of apoptosis by DDX41 knockdown. (Upper) Representative images of flow cytometric analysis of K562 cell apoptosis. (Lower) Bars indicate means; error bars, SDs of triplicate samples; two-tailed Welch’s t test. D Abnormal mitosis after DDX41 knockdown in U2OS cells. Scale bars: 5 μm. E Micronucleus formation by DDX41 knockdown in K562 cells. Percent micronucleus-positive cells in shScramble (n = 176, 194 and 233 cells) and shDDX41#1 (n = 84, 100 and 115 cells) groups were analyzed 3 days after lentivirus infection. (Left) Yellow and white arrows indicate micronuclei positive and negative for γ-H2AX, respectively. Scale bar: 10 μm. (Right) Bars indicate means; error bars, SD of triplicate samples; two-tailed unpaired Student’s t test. F Inhibition of DNA replication by DDX41 knockdown in K562 cells. (Upper) Representative images of flow cytometric analysis of BrdU incorporation. (Lower) Bars indicate means; error bars, SD of triplicate samples; two-tailed Welch’s t test. G Slowed replication fork progression by DDX41 knockdown in HeLa cells. (Upper) Dual labeling with DNA analogs and representative images of DNA fibers. Thymidine analogues were visualized via immunofluorescence (CldU, green; IdU, red). (Lower) Fork progression speed calculated for each sample. Bars indicate means ± SD; n = 269 and 271 for siControl and siDDX41#1, respectively; two-tailed Welch’s t test. H Induction of γ-H2AX signals by DDX41 knockdown in HeLa cells. Three days after siRNA transfection, flow cytometry analysis was performed. (Upper) Histogram of γ-H2AX levels. (Lower) Percent γ-H2AX-positive cells in each cell group. Bars indicate means; error bars, SD of triplicate samples; two-tailed Welch’s t test. I Cell cycle changes by DDX41 knockdown in HeLa cells. Three days after siRNA transfection, flow cytometry analysis was performed. (Left) Representative flow cytometry plots of cells stained with anti-phosphorylated histone H3 (pHH3) antibody and Propidium Iodide (PI). (Right) Percent cells at G2 and M phases. Bars indicate means; error bars, SD of triplicate samples; two-tailed Welch’s t test.

