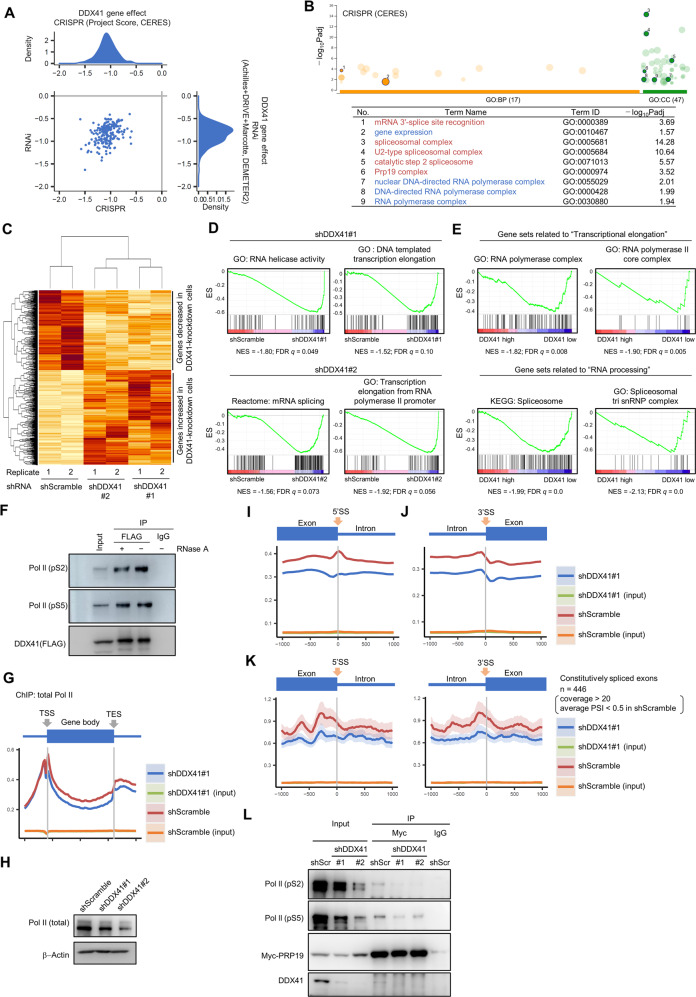
Fig. 7. Changes in gene expression and distribution of Pol II by DDX41 knockdown.
A Dependence of cell lines on DDX41. We used DepMap portal (https://depmap.org/portal/). For density distributions for CRISPR and RNAi data, smaller scores indicate that DDX41 is essential for cell line survival; −1 was comparable to the median of all pan-essential genes. B Genes co-dependent with DDX41 include those related to RNA splicing and Pol II-mediated transcription. Top co-dependent genes with DDX41 (with q values <0.05) identified in CRIPR screening were subjected to GO analysis; results were visualized via g:Profiler (upper). Representative GO terms related to RNA splicing (red) and Pol II-mediated transcription (blue) were numbered (lower). Table S1 gives the complete list. C Gene expression changes by DDX41 knockdown. A hierarchical clustering of 1341 genes that showed expression changes with p < 0.05 in common in shDDX41#1- and shDDX41#2-expressing DDX41-knockdown cells compared with shScramble-expressing control cells was visualized. D Representative gene sets associated with RNA splicing and transcriptional elongation negatively enriched in shDDX41#1- and shDDX41#2-expressing cells. ES, enrichment score; NES, nominal enrichment score. E Representative gene sets associated with transcriptional elongation and RNA processing negatively enriched in DDX41 low-expressing AML cases. The 451 AML cases presented in the article by Tyner et al. [48] were divided into three groups according to the expression level of DDX41, and the transcriptome differences between groups with DDX41 expression levels below mean −SD (DDX41 low) and above mean +SD (DDX41 high) were examined. F Direct interaction of DDX41 with Pol II in HEK293FT cells. Protein extracts from cells expressing FLAG-DDX41 were immunoprecipitated with anti-FLAG antibody or control IgG and then probed with anti-FLAG and anti-Pol II (pS2 and pS5) antibodies. G Average distribution of total Pol II from transcription start site (TSS) to transcription end site (TES) of all RefSeq transcripts visualized with Ngsplot. H Changes in Pol II expression in DDX41-knockdown HEK293FT cells. I, J Average distribution of Pol II around exon/intron boundaries. Distribution of Pol II around 5′SS (I) and 3′SS (J) of genes expressing above the median in control cells are shown. K Average distribution of Pol II around exon/intron boundaries of constitutively spliced exons. Exons that met requirements of coverage >20 and average PSI < 0.5 were selected, and average distributions of Pol II up to 1000 bases upstream and downstream of the 5′SS (left panel) and 3′SS (right panel) of exons were visualized with Ngsplot. L Reduced interaction of PRP19 with pS2- and pS5-modified Pol II. Protein extracts from DDX41-knockdown HEK293FT expressing Myc-tagged PRP19 were immunoprecipitated with anti-Myc antibody or control IgG. The samples were probed with anti-Pol II (pS2 and pS5), anti-Myc and anti-DDX41 antibodies.

