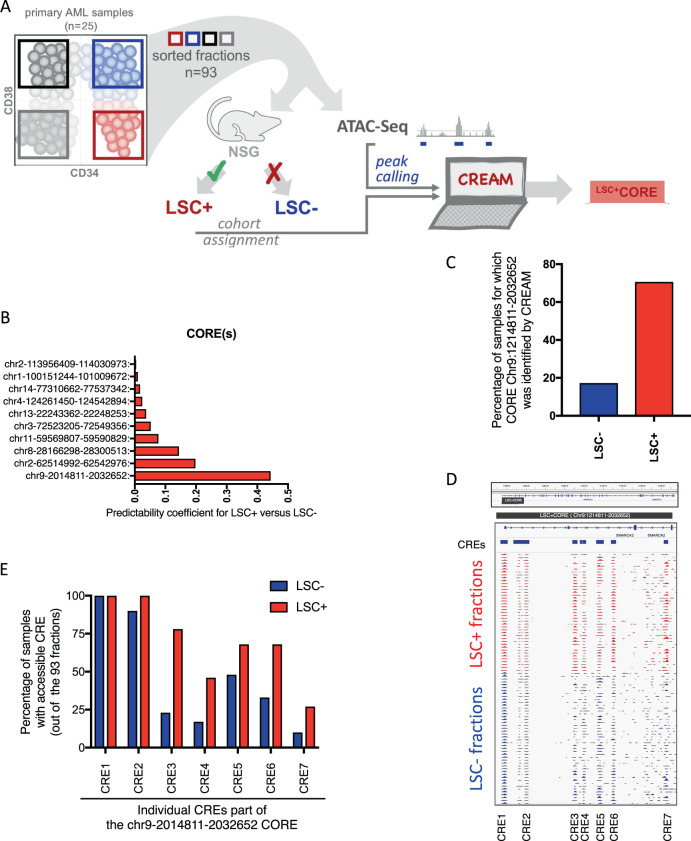
Fig. 5. Chromatin accessibility profile of LSC enriched and depleted fractions identifies COREs discriminating LSC+ from non-LSC fractions.
A Schematic representation of the experimental strategy, B coordinates and predictability coefficient for LSC+ vs. LSC− for CORE that are detected in either LSC+ or LSC− fractions. C Percentage of LSC− and LSC+ fraction for which CREAM algorithm detects the CORE-chr9 2014811-2032652, out of the 93 fractions sequenced, D IGV representation of the CORE-chr9 2014811-2032652 for primary AML LSC+ and LSC− fractions, E Percentage of LSC+ or LSC− primary AML fractions for which CRE part of the CORE of interest are accessible out of the 93 fractions sequenced.

