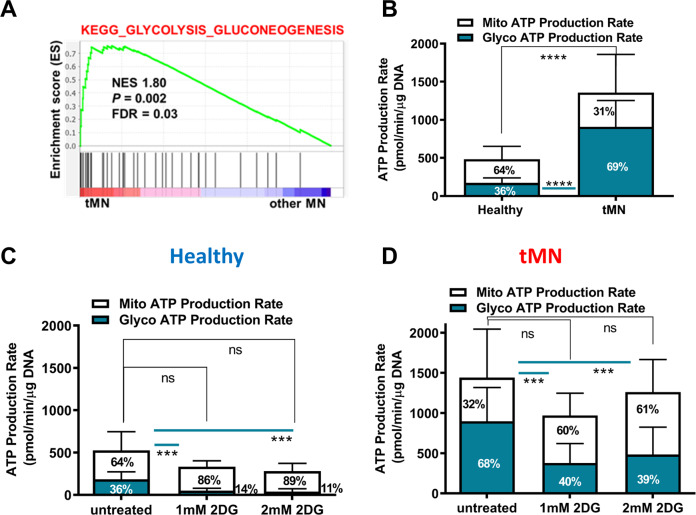
Fig. 4. tMN BMSC display glycolytic metabolic state.
A GSEA example of BMSC from tMN vs. other MN shows enrichment of metabolic pathways. The normalized enrichment score (NES), P values and false discovery rate (FDR) are given; B comparison of mitochondrial ATP (mitoATP) production rate and glycolytic ATP (glycoATP) production rate between Healthy (n = 3) and tMN BMSC (n = 5). Data were expressed relative to the total DNA. Effect of glycolysis inhibitor 2DG on mitochondrial and glycolytic production rate in C Healthy BMSC (n = 3) and D tMN BMSC (n = 3). All bars indicate mean, and all error bars indicate SD. Mann–Whitney test was used to detect statistically significant differences between cohorts. Asterisks display P values **P < 0.01, ****P < 0.001.

