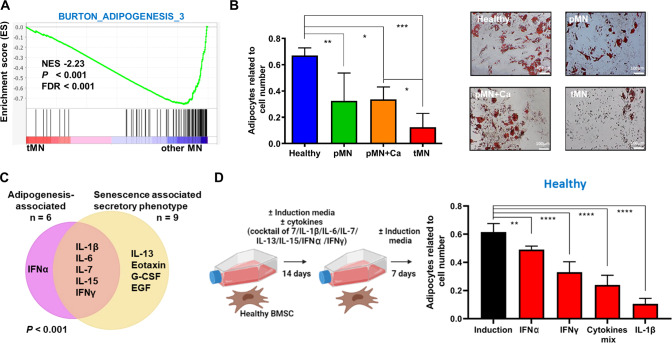
Fig. 5. Defective adipogenesis of tMN BMSC.
A GSEA plot showing the specific deregulation of gene sets associated with adipogenesis in BMSC from tMN and other MN. NES, FDR and P values are given; B quantification of Nile red-stained lipid droplets, relative to total number of DAPI stained cells. BMSC were cultured under adipogenic inductive conditions for 4 weeks (Healthy n = 8; pMN n = 5; pMN+Ca n = 3; tMN n = 11). Representative micrographs of Oil red stained lipids. Scale bars indicate 100 μm; C Venn diagram representing significantly different cytokines related to SASP and adipogenesis in tMN BMSC compared to Healthy, as well as those cytokines which are in common in SASP and adipogenesis-associated groups; D schematic of the Healthy BMSC co-culture experiments with various cytokines. Healthy BMSC were cultured in adipogenesis-induced media with either seven cytokines cocktail, or individual cytokines such as IL-1β, IL-6, IL-7, IL-13, IL-15, IFN2A or IFNγ. Following 14 days, Healthy BMSC were cultured without cytokines for 7 days and adipogenic differentiation was investigated. The number of adipocytes was enumerated by counting Nile Red-labelled cells and DAPI-labelled cell nuclei. The results from three Healthy BMSC are shown (n = 3). All bars indicate mean, and all error bars indicate SD. Mann–Whitney test was used to detect statistically significant differences between cohorts. Asterisks display P values *P < 0.05, **P < 0.01, ***P < 0.001, ****P < 0.0001.

