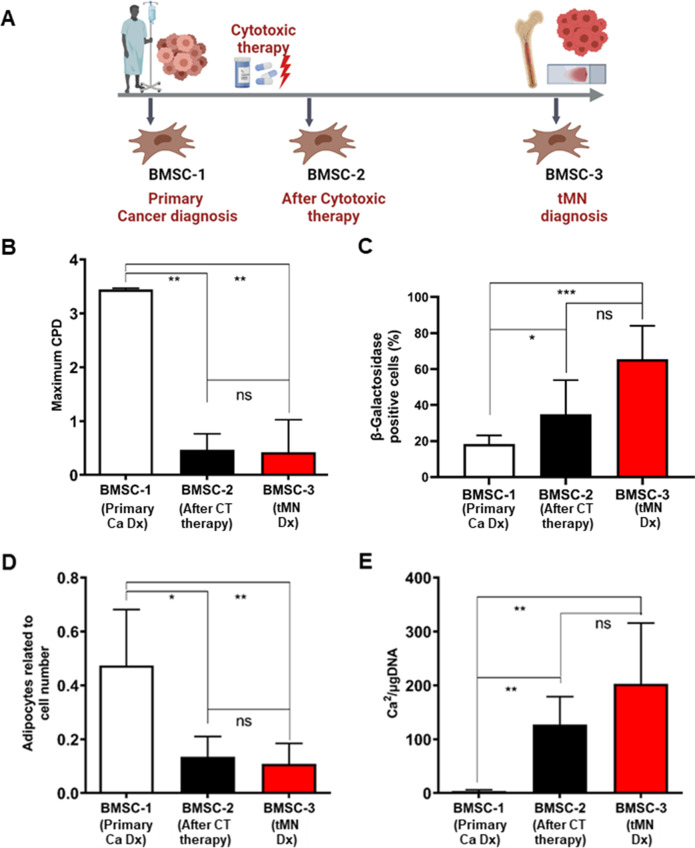
Fig. 8. Irreversible long-term BMSC damage is induced by CT in tMN patients.
A Schematic of tMN patient journey and serial BMSC collection such as at the time of primary cancer (BMSC-1), after completion of initial CT (BMSC-2) and at diagnosis of tMN (BMSC-3); B proliferation potential assessed by Maximum CPD; C quantification of senescence levels assessed by β-Galactosidase-stained cells; D adipogenic differentiation of BMSC quantified at 21 days by Nile red-stained lipid droplets; E quantification of mineral content by measuring the concentration of Ca2 in an acid-solubilized matrix and normalizing them to the total DNA. The results from three tMN patients (n = 3) at different time are shown; All bars indicate mean, and all error bars indicate SD. Scale bars indicate 100 µm. Mann–Whitney test was used to detect statistically significant differences between cohorts. Asterisks display P values *P < 0.05, **P < 0.01, ***P < 0.001.

