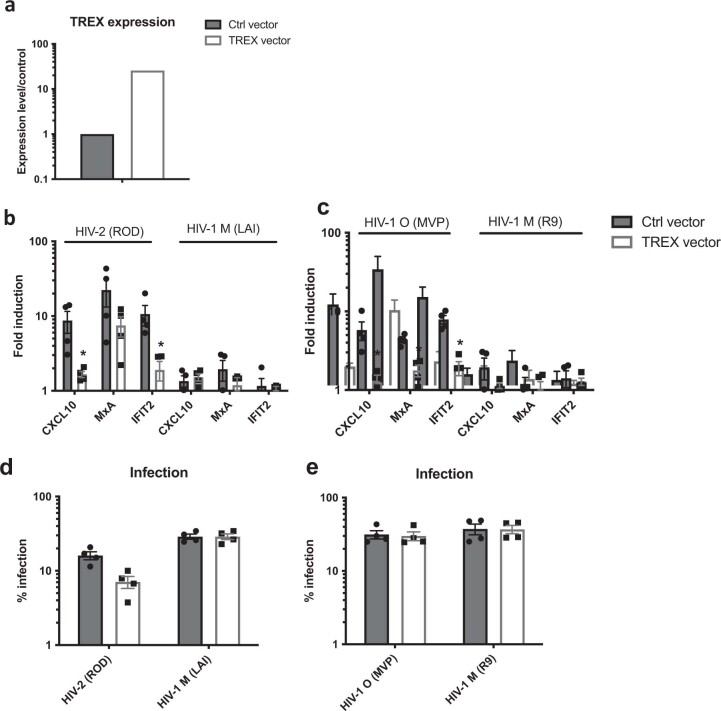
Extended Data Fig. 3.
a. A representative example of GAPDH-normalised TREX1 mRNA levels measured after transduction of THP-1 cells with empty (Ctrl) MLV vector or TREX1 expression vector. b, c. GAPDH-normalised ISG mRNA levels, expressed as fold induction over uninfected, in control vector (Ctrl) or TREX1-expressing THP-1 cells with HIV-2 and HIV-1(M) or HIV-1(O) with d, e. infection levels in parallel wells measured 48 hpi. Mean + /− SD, n = 3 independent experiments. b,d two-tailed paired t-test vs THP-1 Ctrl vector. *p < 0.05.

