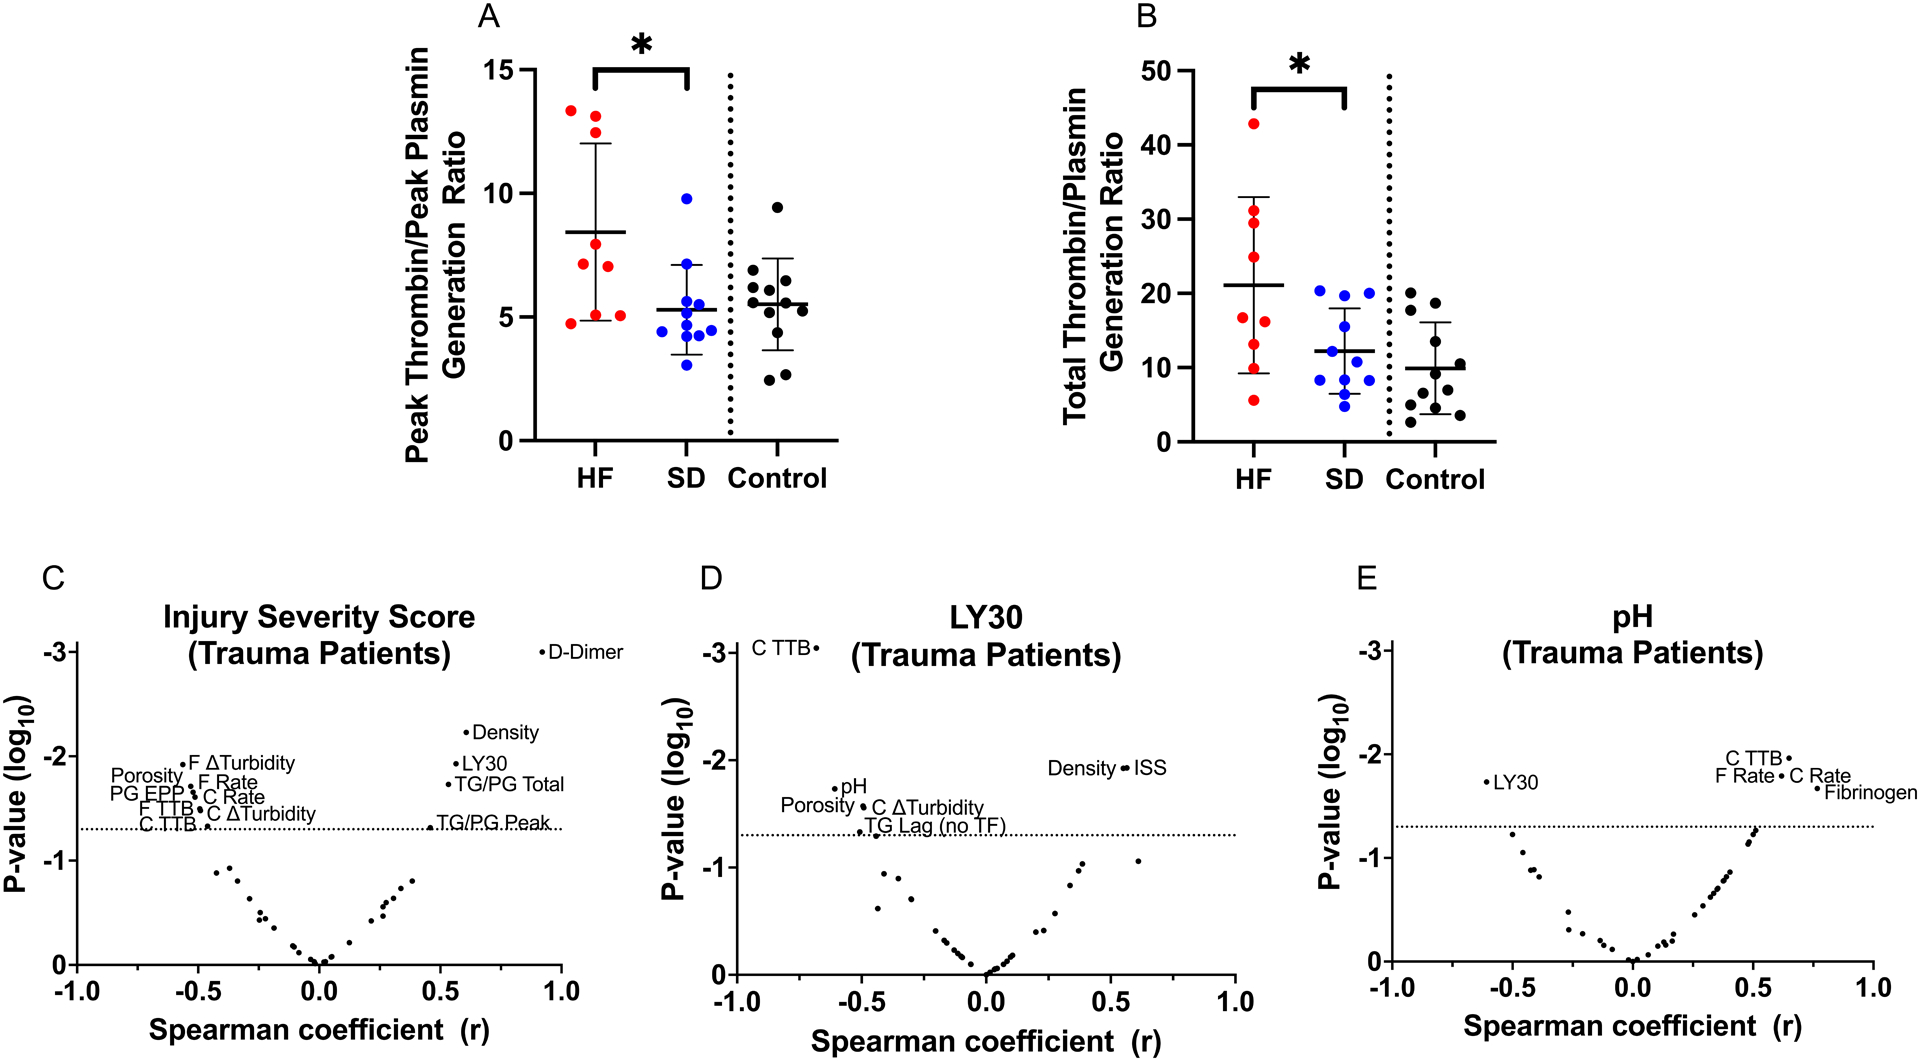
Figure 5. Injury severity correlates with parameters from plasma-based assays of coagulation and fibrinolytic potential.

(A-B) Ratios of measurements from TG and PG assays were calculated by dividing each TG parameter by the corresponding PG parameter. Panels show ratios for (A) peak and (B) total TG-to-PG. (C-E) Volcano plots showing Spearman correlations (x-axis) and significance (y-axis) for selected parameters: (C) Injury severity score, (D) LY30 for trauma patients, and (E) pH for trauma patients.
