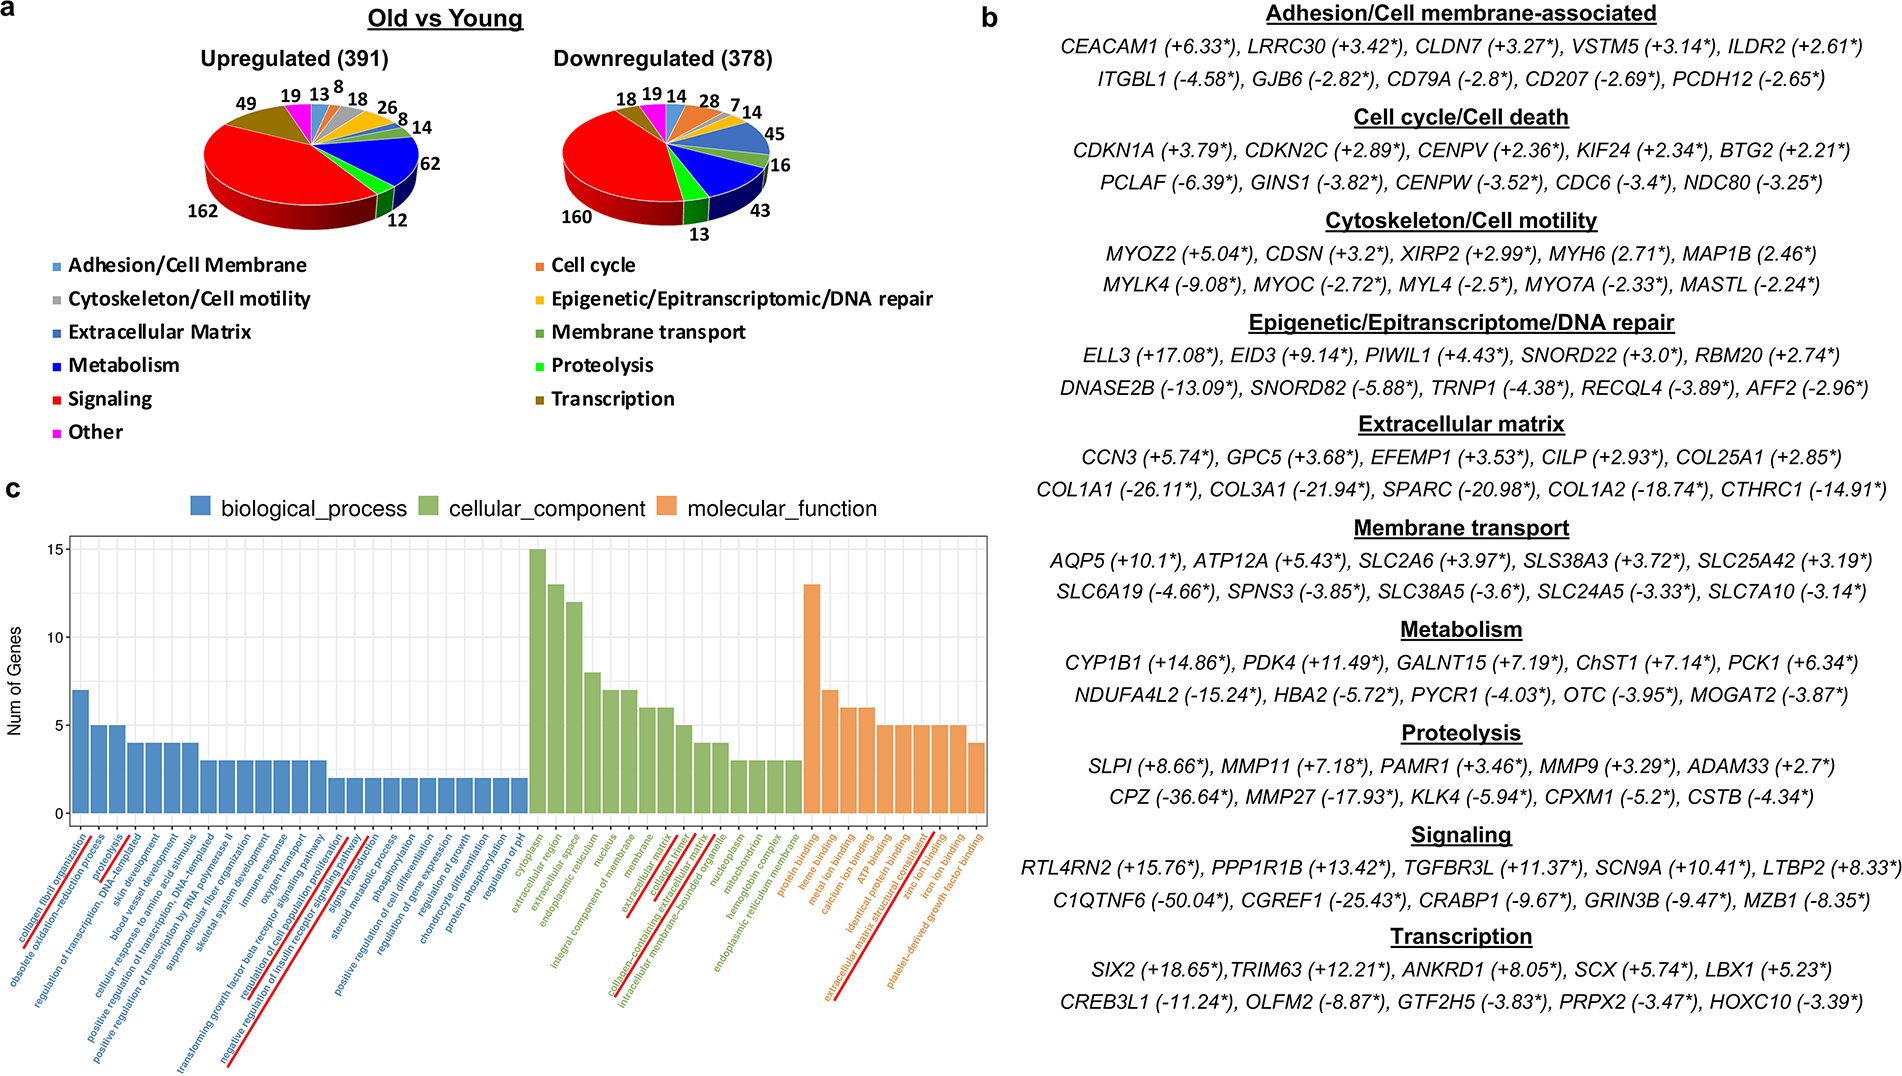
Figure 4. RNAseq analyses of the age-associated changes in the cutaneous NMR transcriptome.

(a) Functional annotation of the differentially expressed genes based on QIAGEN Ingenuity Pathway Analysis database and manually curated functional gene sub-categories. (b) A list of five top differentially expressed genes in each functional group (fold-change expression values are indicated by asterisks). (c) GO enrichment analysis showed significant over-representation of the extracellular matrix-associated genes, components of the insulin growth factor (IGF) signaling pathway, regulators of the glucose metabolism and cell proliferation.
