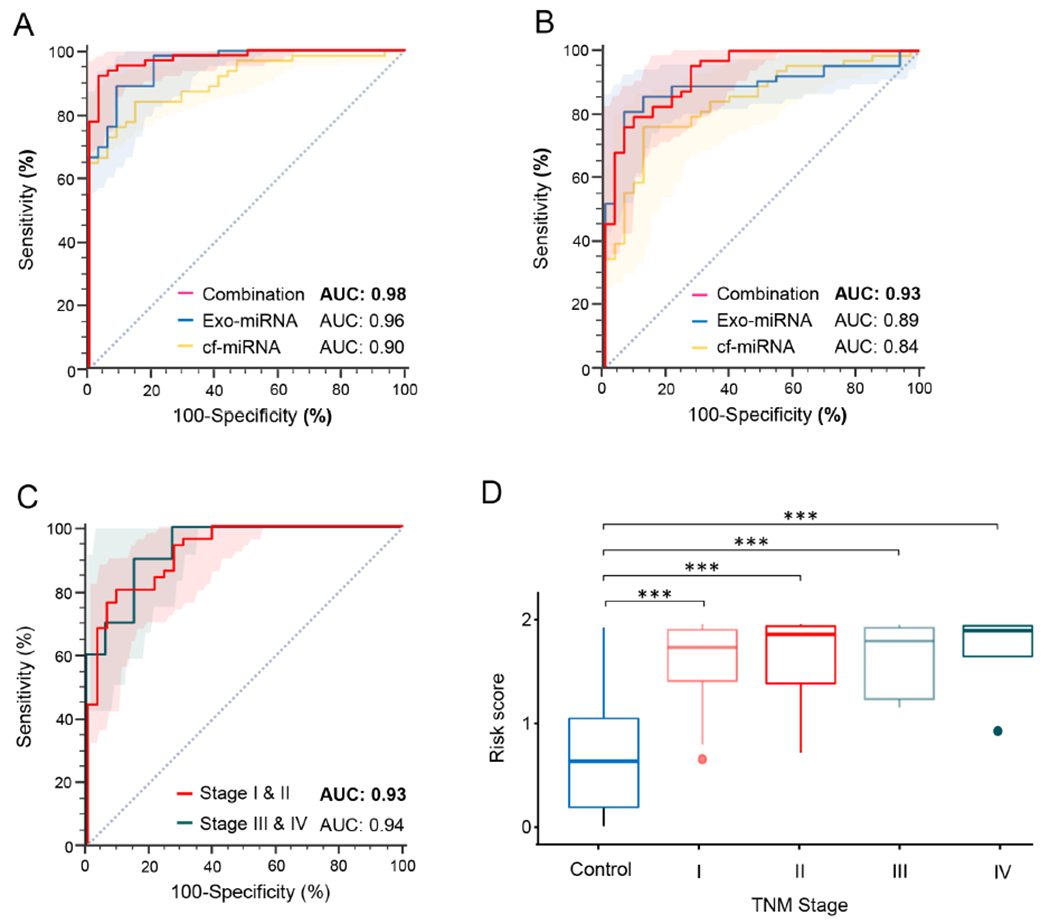
Figure 3.

Prioritization and performance evaluation of cell-free and exosomal miRNA biomarker panel in clinical cohorts. (A) ROC curve analysis for the cf-miRNA, exo-miRNA or cf and exosomal combination panel in the training cohort. (B) ROC curve analysis for the cf-miRNA, exo-miRNA or cf and exosomal combination panels in the validation cohort (C) ROC curve analysis to identify early-stages (stage I and II) and late stages (stage III and IV) PDAC patients from non-disease controls in validation cohort. (D) Risk score analysis in all stages PDAC patients and non-disease controls in the validation cohort. ROC curves are shown with 95% CIs. [*p< 0.001, Exo: exosomal; miRNA: micro RNA; cf: cell-free; AUC: Area under the curve; TNM: tumor-node-metastasis; PDAC: pancreatic ductal adenocarcinoma; ROC: receiver operating characteristic]
