
Fig. 4:
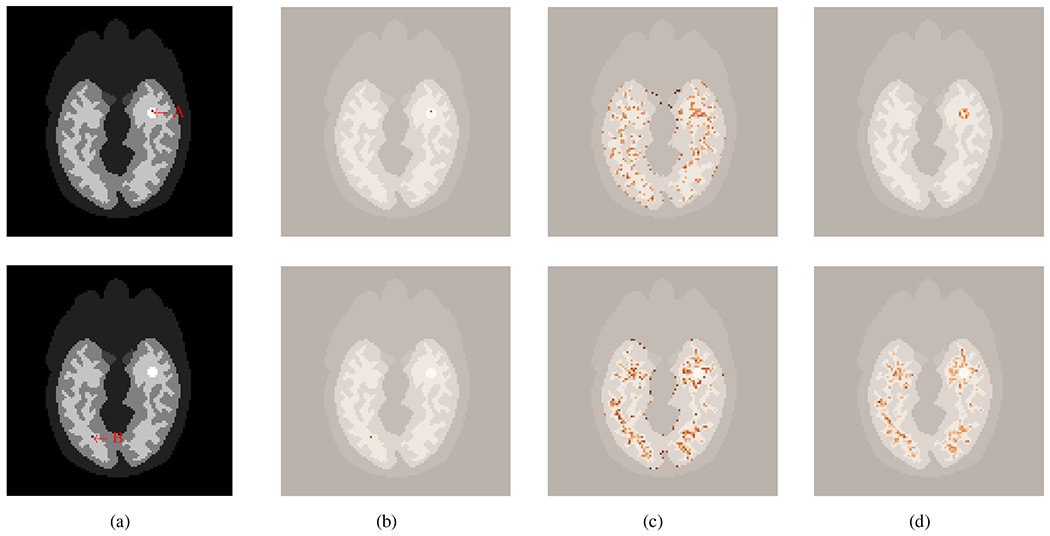
Illustration of two query pixels and the attention maps provided by different methods. (a) location of the two query pixels - one in the tumor region (top, A) and the other in the white matter (bottom, B), (b-c) attention maps by traditional ML-EM (b), conventional kernel method (c), and the proposed deep kernel method (d). All the attention maps are overlaid on the structural image.